
THIRD MEETING OF THE EDITORIAL BOARD OF THE IASC/IOC/IHO
|


 |  |
Figure 7. The large area (ca 180 000 km2) indicated by no 1 was updated by incorporating the 1x1 km DTM from NPD. The small boxes show dubious features pointed out by NPD. Figure A shows the Beta grid and Figure B the updated version of IBCAO were the erroneous features are removed and the 1x1 km DTM from NPD included.
The above-mentioned main features i-iv were found to derive from the following sources:
i) An outlier from the Hawkbill 1999 data.
ii) Soundings from the Norwegian Institute of Fisheries
iii) Soundings from the Norwegian Institute of Fisheries
iv) Data retrieved from NGDC
These soundings and the soundings causing the smaller features that were questioned by NPD in Norwegian waters have been flagged, and will not be included in the gridding of the updated IBCAO version.
4.1.2. New data from the Norwegian Petroleum Directorate
An area of ca 180 000 km2 has been covered by multibeam surveys carried out by NPD using a Simrad EM12-multibeam sonar during the summers of 1999 and 2000 (Figure 7). The data has been processed by NPD and provided to IBCAO as a 1x1 km DTM. The updated version of the IBCAO grid makes use of this entire DTM. Figure 7 shows a comparison between the Beta version of IBCAO and the new updated version in the area where the multibeam data from NPD has been included.
4.1.3. Error due to gridding in the Franz Josef Land Archipelago
In the Franz Josef Land Archipelago a false island appeared due to overshooting of the surface spline in tension gridding algorithm (Figure 8). This island has been removed by inserting depth values derived from the nearest contours, which has the effect of suppressing the overshooting in the gridding process.
 |  |
Figure 8. False island in the Franz Josef Land Archipelago (A) that appeared due to overshooting of the surface spline in tension gridding algorithm. This island has been removed by inserting depth values derived from the nearest contours, which has the effect of suppressing the overshooting in the gridding process (B).
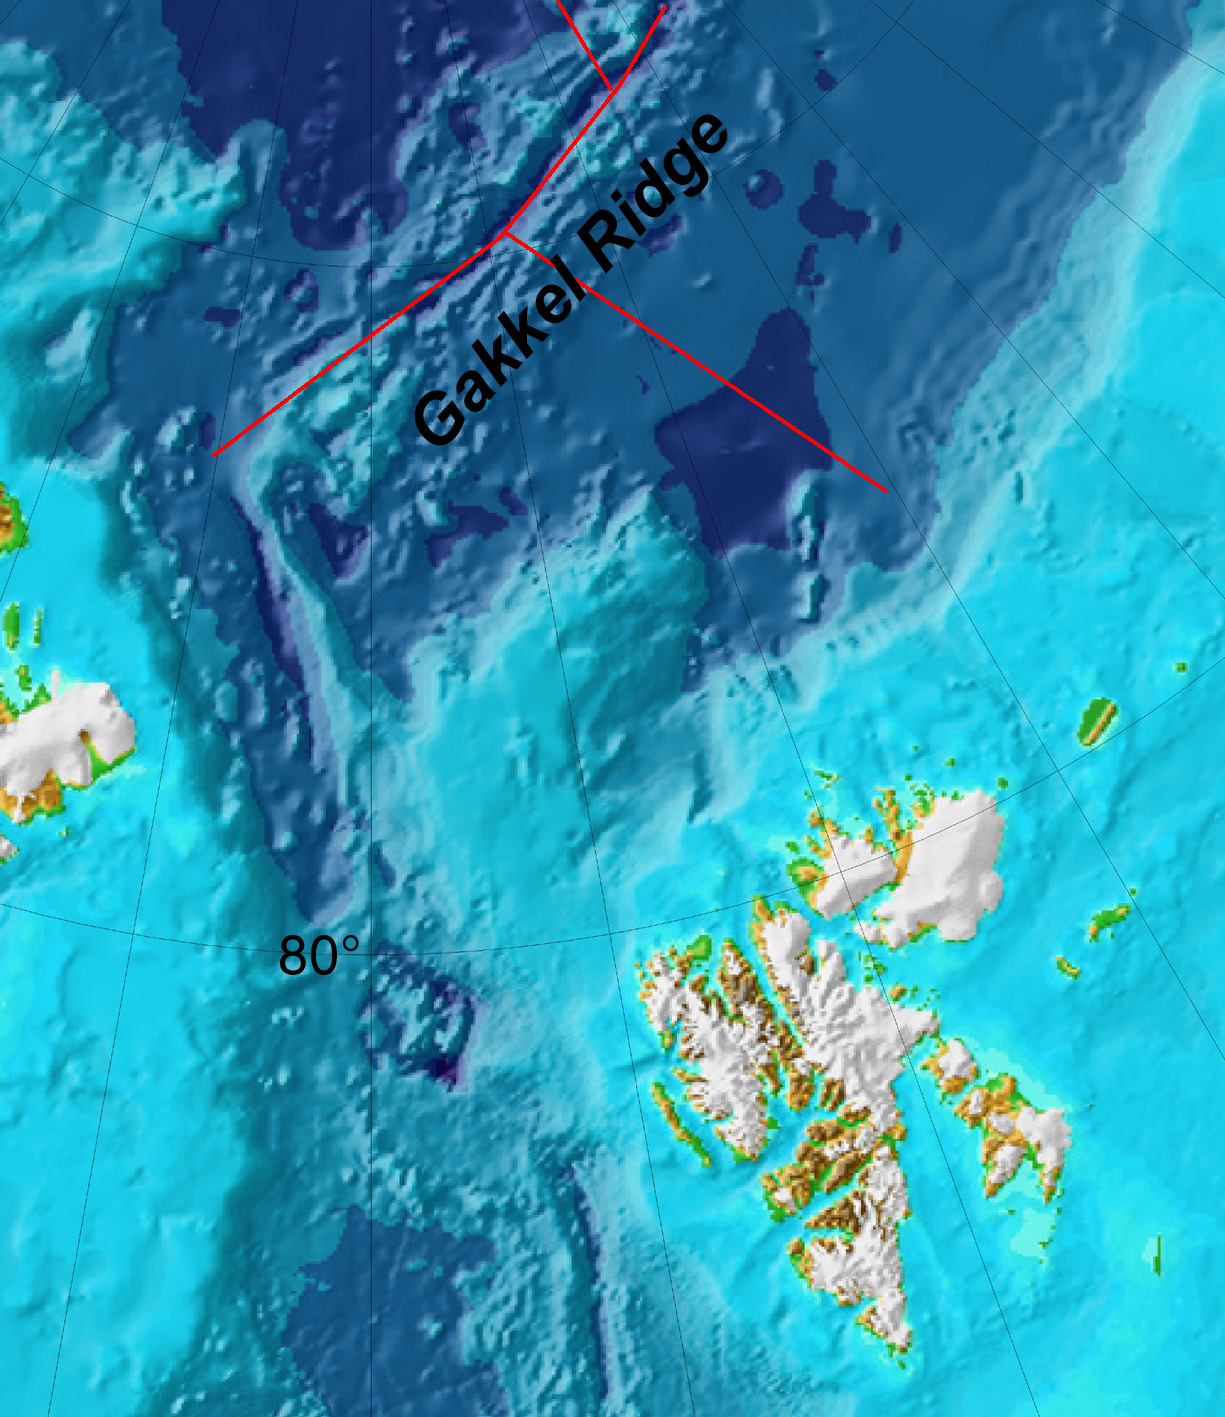
4.1.4. False seamount like features north of Svalbard
North of Svalbard three elongated features trending NNE from approximately 81°50'N/23°E, with a max relief of approx 2000 m, caught our attention while developing a method for error estimation using the area around Svalbard as a test data set (see section 5). These features were associated with high errors in our error estimation (Figure 9). In addition, NPD also raised their doubts about these features. Finally, the new data from cruise ARK-XV/2 in 1999 with R/V Polarstern proved that these features did not exist. They arose from data collected by the Swedish icebreaker Oden in 1991. In the updated version of IBCAO these features are removed (Figure 10).
4.1.5. New data on the Alaskan Pacific margin from the Naval Oceanographic Office
Contours from NIMA charts over the Pacific margin have been digitized by NAVOCEANO. These contours are included in the updated version of IBCAO in order to supplement the contours from GEBCO used in the compilation of the Beta version of IBCAO.
4.1.6. Newly incorporated data from AWI cruises with Polarstern
New AWI data incorporated in the Alpha version of IBCAO includes Hydrosweep (center beam) data from the ARK-XV/2 cruise in 1999, and Hydrosweep (all beams) data from the ARK-VII in 1991. The latter data set has been processed at the Center for Coastal and Ocean Mapping using CARIS HIPS. Figures 10 and 11 show the results of including the ARK-XV/2 and ARK-VII data, respectively. However, it was decided during the meeting that AWI will deliver a 1x1 km dtm based on all they Hydrosweep data north of Svalbard and in the Fram Strait. This data will be included in the updated version of IBCAO.
4.1.7. Dubious feature in the Canada Basin
A seamount-like feature located at approximately 73°54'N/138°54'W in the Beta grid was derived from contours digitized from the HDNO/VNIIO/RAS (1999) map (Figure 12). Canadian hydrographic observations at this location do not confirm the existence of this feature, therefore we removed these contours from the updated version of IBCAO.

Figure 9. 3D-image, created using the software Fledermaus, showing the estimated standard deviation as a percentage of the depth draped on the IBCAO bathymetry. The error estimate shows clearly that significant error is associated with the indicated seamount like features later revealed not to exist by a recent survey with R/V Polarstern.
 |  |
Figure 10. North of Svalbard (Box 6) three elongated features trending NNE with a max relief of approximately 2000 m were present in the IBCAO Beta version (A). These features were caused by erroneous data from the Swedish cruise with ice breaker Oden in 1991. In the updated version of IBCAO these features have been removed (B). Box 2 indicates the area were data has been included in the updated version of IBCAO from cruise ARK-XV/2 in with R/V Polarstern, 1999.
 |  |
Figure 11. In the area of the Lomonosov Ridge indicated by box 3 Hydrosweep (all beams) data from the ARK-VII cruise in 1991 have been incorporated into the updated version of IBCAO (B). The data was processed at the Center for Coastal and Ocean Mapping using CARIS HIPS.
4.1.8. Dubious submarine track in Barrow Strait
Part of a submarine track executed between 1958 and 1962 portrays an elongated feature at a much greater depth than the surrounding data (Figure 13). Matching crossings at either end of this feature suggest that this part of the track is doubtful. Therefore, this part of the track was removed from the compilation of the updated version until it could be verified.
4.2. Topography updates
4.2.1. Alaskan topography updated from GLOBE
The IBCAO topography derives from GTOPO30, although it will be updated in areas where the GLOBE data set offers a more accurate topography. Errors were discovered in the area covered by GLOBE tile A, which derives in part from GTOPO 30. These errors have been updated in Release 1.1 of GLOBE, warranting a similar update in IBCAO. Below is the information about the updates, as it appears in the GLOBE readme file:
|
1. |
In the area between 66 and 67 degrees north latitude, 162 and 165 degrees west longitude: The data were discovered to be low by a ratio of feet to meters. This suggests that the original Defense Mapping Agency data, reformatted and distributed by the U. S. Geological Survey (GLOBE data type 5) were erroneously divided by that ratio. The source 3 arc-second data were multiplied by 3.28, compared with Digital Terrain Elevation Data for confirmation, then substituted at these new values into tile A. In source/lineage tile a11s, corresponding to this data tile a11g, areas so changed were given a source/lineage category 51. This class is considered original source 5, modified by GDC for GLOBE update version 1.1 for this tile. At the time of this work, other DEMs still apparently use the erroneously vertically referenced category 5 data in this area. |
|
2. |
In the area between 61 and 62 degrees north latitude, 162 and 163 degrees west longitude: The source 3 arc-second USGS tile was found to cover only the northern half of this 1-degree area. The 3 arc-second data (GLOBE data type 5) were resampled to 30", and combined with DTED level 1 discrete data (GLOBE data type 1) covering the southern half of the area. The resultant tile was compared with Digital Terrain Elevation Data for confirmation, then substituted into tile A. In source/lineage tile a11s, corresponding to this data tile a11g, areas so changed were given a source/lineage category 51. This class is considered original source 5, modified by NGDC for GLOBE update version 1.1 for this tile. Note that some of the updating uses GLOBE source/lineage category 1 data to replace nonexistant (previously misplaced) source/lineage category 5 data. At the time of this work, other DEMs still apparently use the misplaced category 5 data in their compilations.
Figure 12. The seamount-like feature (indicated by the arrow) in the Beta grid was derived from contours digitized from the HDNO/VNIIO/RAS (1999) map. Canadian hydrographic observations at this location do not confirm the existence of this feature, therefore we removed these contours from the updated version of IBCAO.
Figure 13. The arrow points at the part of a submarine track executed between 1958 and 1962 that portrays an elongated feature at a much greater depth than the surrounding data. Matching crossings at either end of this feature suggest that this part of the track is doubtful. Therefore, this part of the track was removed from the compilation of the updated version until it could be verified. |
|
3. |
In the area between 69 and 69 degrees north latitude, 134 and 135 degrees west longitude: The lowest-lying part of the Mackenzie River delta was labelled 15 meters, whereas the majority of that part of the delta (e.g. immediately to the west and south) was labelled 1 meter elevation. Many such modest discontinuities are found between 1x1 degree DTED cells. In this case, however, visualizations of the data were adversely affected. So that part of the delta in the abovementioned area was relabeled to 1 meter elevation, to be consistent with the data for the rest of the delta. In the source/lineage tile a11s, corresponding to this data tile a11g, areas so changed were given a source/lineage category 3a. This class is considered original source 3, modified by NGDC for GLOBE update version 1.1 for this tile. At the time of this work, other DEMs still apparently use the discontinuous category 3 data in their compilations. This work was assisted by Sven Trudeau, of the Ecole Superieure des Geometres et Topographes (ESGT), Le Mans, France, during his visit to NGDC during January-July 2000, working on GLOBE. |


4.3.0. Conversion to general GIS formats
Several IBCAO users have reported difficulties in importing the grid to various types of GIS software. This appears to be a particular problem for ArcView users, due to a mismatch between other GIS data such as vector coastlines and the zero metre level in the IBCAO grid. We have found that this is caused by a limitation in ArcView where the true scale (75°N for IBCAO) cannot be set in the polar stereographic projection which is supported in ArcView, nor can this projection be used with the WGS 1984 datum. Therefore we will take on the task of converting the IBCAO grid to formats suitable for some of the most widely used GIS and mapping software.
4.4.0. GEBCO Digital Atlas
The updated version of the IBCAO grid will be included in the global 1 min grid of the GEBCO Digital Atlas, which is scheduled to be completed during the summer of 2001. This will require a conversion of the polar stereographic grid to a geographic 1 min grid, or to regrid all the original un-projected cleaned data to a geographic 1 min grid. The latter approach is not feasible since the GMT gridding algorithm performs poorly at very high latitudes. After consultation with Walter Smith a conversion method was found:
- Construct a geographic dummy grid of the area to be included (180°W-180°E, 64°-90°N) containing zeros as z-values.
- Project this grid to the IBCAO projection (polar stereographic, true scale at 75°N). This was done using the GMT program mapproject (Wessel and Smith, 1990).
- Use the GMT program grdtrack to interpolate points to projected coordinates of the dummy grid by using a linear interpolation and an associated grid (the new version of the polar stereographic IBCAO grid).
- Unproject the interpolated points from grdtrack
- Use the GMT program xyz2grd to create a netCDF geographic 1 min grid from the exercise above.
The result is shown in Figure 14.
GEBCO contour map: Norm Cherkis
The GEBCO Sixth Edition continues to evolve, but there are still no final plans for publication. One group favours "print on demand" while another favours printed maps. A gridded version is envisioned for the final product, however the present effort is to produce an updated, GEBCO Digital Atlas (GDA) in 2001. A "beta" version of GDA-2001 is presently in the hands of members of the GEBCO Subcommittee on Digital Bathymetry.
This version of the GDA (GDA-2001) will be updated by assimilating and edge-matching contours derived from the current version of the IBCAO grid. Departing from the standard GEBCO contours, however, the IBCAO data will be incorporated with the following contour intervals: 20, 50, 100, 150, 200, 250, 300, 350, 400, 500, 600, 800, 1000, 1200, 1400, 1500, 2000, 2500, 3000, 3500, 4000, 4500, 5000, 5500 and 6000 meters.
Cherkis will take the most complete set of these contours, provided by Martin Jakobsson of UNH, to the British Oceanographic Data Centre (BODC) in late June or early July of this year. The intention is to load them into BODC's GEBCO data base, and to make proper edge matches with GEBCO sheets 5.01 through 5.04. The work is expected to take about two weeks. The general release of the GDA-2001 is scheduled to occur late in 2001.
IOC contour map: Ron Macnab
At the last meeting of the Editorial Board, it was announced that HDNO had funds budgeted for printing Arctic sheets in the standard cartographic format of the IOC's International Bathymetric Charts (IBC) series. It was agreed that Martin Jakobsson and Sergei Maschenkov would discuss procedures for extracting a suite of standard isobaths from the IBCAO grid, which would then be conveyed to HDNO for use in constructing the IBC sheets. However during the May 2000 Arctic Earth Science Week in St. Petersburg, HDNO personnel expressed reservations about portraying grid-derived isobaths, and stated their preference for showing contours based upon actual observations,


Figure 14. Shaded reliefs portaying the 1x1 min geographic grid (see text about compilation).
which could be extracted from the official map that was published by their organization and VNIIO in 1999. The matter was not further pursued at the time, and when it was brought up for discussion at the recent CGOM Meeting in St. Petersburg, no decision was taken concerning final action. Therefore for the time being, the matter is considered to be under IOC and HDNO advisement, and the Editorial Board will initiate no new action unless and until a specific request is received from IOC.
Sound speed correction model for the Arctic Ocean: Robert Anderson
Currently, sound speed corrections for the Arctic are based on Carter's Tables, which were generated using data collected in the early 1970s. Owing directly to a lack of oceanographic observations, the entire Arctic was lumped into one table, implying the lack of diversity in water masses in the region. Recently there have been several expeditions in the Arctic, both on the surface and below the ice, that have collected CTD data. Preliminary examination of the more recent information suggests that the Arctic is actually characterized by several velocity provinces. A more detailed and definitive investigation and collection of oceanographic data needs to be performed, and funding is being sought for this purpose.
5. Other IBCAO-related investigations
Spectral comparison between IBCAO bathymetry and ERS gravity: geophysical implications: David McAdoo and Seymour Laxon
Comparisons of the UCL/NOAA ERS Arctic marine gravity field (Version 3) with the IBCAO (Beta grid) bathymetry have been made using one-dimensional spectral techniques. These comparisons can help define the density and mechanical structure of the crust and upper mantle for portions of the Arctic Basin. Moreover, such comparisons reveal that: bathymetry in selected places such as the Chukchi Borderlands and the Mendeleev ridge is highly correlated with gravity, and is isostatically supported by a thin (<5 km), weak lithosphere - not unlike the Basin and Range Province in the western US. In many other areas of the Arctic such as the Canada Basin or the Siberian shelves, these bathymetry and gravity are quite uncorrelated due to processes such as erosion and sedimentation. In such areas if bathymetry is sufficiently smooth it may be possible to use gravity power spectra (PSDs) to help characterize basement topography or sediment thickness. The current version of the UCL/NOAA ERS Arctic marine gravity field may be obtained from the web at: http://ibis.grdl.noaa.gov/SAT/curr_res/polar.html.
Estimation of errors in sparse bathymetric geophysical data sets with IBCAO as a case study: Brian Calder and Martin Jakobsson
We considered the problem of estimating the quality of gridded bathymetry when the input data consists of multiple datasets of varying origin and, thus, quality. In combining these data, we are also often forced to use a complex interpolation scheme due to the sparseness and irregularity of the data points. Consequently, we are faced with the difficult task of assessing the confidence that we can assign to the final grid product, a task that is not usually addressed in most bathymetric compilations This has important implications on use of the gridded data, especially when it is used in support of further oceanographic modeling tasks.
We approached the problem via a direct-simulation Monte Carlo method. We started with a small subset of hand-cleaned data from the (IBCAO) grid model. The test dataset shows examples of data sources ranging from single beam soundings with available metadata to spot soundings with no available metadata and digitized contours. From this database, we assigned a priori error variances based on available meta-data, and when this was not available, based on a worst-case scenario in an essentially heuristic manner. We then generated a number of synthetic datasets by randomly perturbing the base data using normally distributed random variates, scaled according to the predicted error model. These datasets were next re-gridded using the same methodology as the original product, generating a set of plausible grid models of the regional bathymetry that we could use for standard error estimates. Finally, we repeated the entire random estimation process and analysed each run's standard error grids in order to examine sampling bias and variance in the predictions. The final products of the estimation were a collection of standard error grids at different resolutions, a measurement of estimation reliability, and an overall assessment of gridding algorithm stability as a function of grid resolution.
Our experiments clearly showed areas of high certainty associated with the more accurate data in the dataset, and regions which were less reliable, typically associated with contour-based data. We also discovered areas of unexpectedly high uncertainty, which we subsequently found to be associated with erroneous data from a single transit line. We combined the estimates of stability at multiple resolutions into a single grid using an acceptability rate of 5% of the estimated depth, and found that areas of low stability typically correlated with significant relief in the seafloor and areas of sparse data. However, assessment of stability must be considered in conjunction with a measure of data density since the interpolation algorithm may be unrealistically stable in the presence of over-abundant data points from correlated data tracks (e.g., contours).
We concluded that prediction of accuracies in final gridded products is possible using this Monte Carlo approach, with the added advantage that the output error assessment is in the same form as the original gridded product. Our predictions on the test dataset agreed with common sense, and provide important caveats on the use of gridded data products. Our analysis at multiple resolutions suggested an approach to estimating stability in gridded products, and the possibility of prediction of grid resolution from data.
Arctic Gravity Map: Bernie Coakle
An Arctic gravity map combining data from the US Naval Research Laboratory (NRL), measurements collected during the SCICEX expeditions, point data from the Geological Survey of Canada (GSC), and satellite derived gravity data is being constructed. The final version of this map is due to be released in 2002. The current version of this map may be viewed at: http://earth-info.nga.mil/GandG/wgs84/agp/.
Map of Arctic Sediment Thickness: Ron Macnab
MAST is an attempt to complement existing thematic geoscientific maps of the Arctic Ocean (bathymetry, gravity, magnetics) with a portrayal of sediment thickness initially in the deep ocean basin, and eventually (circumstances permitting) on the continental shelves. IASC has agreed to sponsor the undertaking, and is supporting a Project Planning Group that first met in 2000, and which is scheduled to meet again in November 2001. From structural and operational viewpoints, the project is loosely patterned after the IBCAO initiative. Details may be obtained from the IASC Project Catalogue, which is available on-line at: http://www.iasc.no
ROUND TABLE DISCUSSION
Following the presentations above, a general discussion ensued with a focus on the future form and direction of the IBCAO project.
IBCAO version 1.0 (grid and printed map)
As noted in foregoing presentations, the IBCAO Beta grid has been updated through various corrections, along with the addition of new data sets. Various options were presented and considered with respect to the format and mechanism for releasing the updated grid and map, referred to as IBCAO Version 1.0.
It was agreed that Grid 1.0 will be placed on the project Website for free downloading by users in a variety of GIS-compatible formats. The structure of this grid will be identical to that of the Beta Grid, i.e. square 2.5 X 2.5 km cells in a Cartesian coordinate system, with origin at the North Pole. NGDC will consider providing a burn-on-demand service, whereby users may request that selected grids be copied to CD-ROM for a nominal fee.
Grid 1.0 will also be provided to the GEBCO organization for inclusion in the 2001 edition of the GEBCO Digital Atlas (GDA). The grid will be presented in two coordinate systems: cartesian (2.5 x 2.5 km) and geographic (1x1 min), the latter to ensure seamless continuity of the GEBCO grid of global bathymetric up to the North Pole. It was announced also that standard GEBCO contours will be extracted from the IBCAO grid for inclusion in the GDA, and that Norm Cherkis will be verifying the continuity of the IBCAO contours with those of the adjacent GEBCO sheets to the south.
There was general agreement to construct a successor to the Provisional Map that first appeared as an insert in Martin Jakobsson's PhD thesis. This map will replicate the general layout of GEBCO Sheet 5.17, i.e. its scale will be 1:6,000,000 at 75°N, and its southern limit will be 64°N (except for extensions to accommodate Greenland, Iceland, etc). The map will actually be realized in a series consisting of one primary map (shaded relief with superimposed depth contours) and three auxiliary maps (depth contours only, data types and distributions, and grid uncertainties). It is anticipated that the primary map will satisfy purposes that are primarily aesthetic, whereas the auxiliary maps are expected to prove useful for a range of scientific and technical applications, e.g. analysis and interpretation, planning, reliability assessments.
Three distribution mechanisms are envisaged for the map(s). (1) The primary and auxiliary maps will be posted on the project Website as plot files for free downloading by users who have suitable plotting facilities at their disposal. (2) NGDC and GSC have facilities for printing and distributing these maps on demand, and one or both organizations may be disposed to offer such a service for a nominal fee; it was left to David Divins and Ron Macnab to explore options with their organizations, and to liaise between themselves with a view to devising a suitable arrangement. (3) Recognizing that there is likely to be a demand for a high-quality hardcopy version of the primary map and that not all users may be inclined to deal with the first two distribution mechanisms, it was decided, subject to a market analysis, that a quantity of such maps should be commercially printed for sale at a nominal price; NGDC will explore options in this respect.
For longer-term consideration, it was suggested that the IBCAO Website be enhanced to include an interactive GIS capability, which would permit users to interrogate selected components of the IBCAO data base, and to construct custom products for downloading. Tools for doing this exist and are readily available, however the design, implementation, and support of such a service will require human resources that are not immediately accessible.
The future of IBCAO
Since its inception, IBCAO has benefited formally from the moral and/or financial support of three sponsoring organizations: the International Arctic Scientific Committee (IASC), the Intergovernmental Oceanographic Commission (IOC), and the International Hydrographic Organization (IHO). According to IASC' s terms of reference, IBCAO is now considered to be a "mature" project that has achieved its primary objective. Consequently, IBCAO no longer qualifies in principle as a formal IASC project that is eligible for financial support; in IASC parlance, the Editorial Board is now designated as a "network". While the implications of this change in status have yet to be fully determined, it is presumed that IASC will maintain its interest in the IBCAO project, and that it will continue to endorse its objectives and operations.
IOC, on the other hand, has made it clear that the IBCAO project should remain an active component of its International Bathymetric Chart program, in order to promote exchange and interaction with similar initiatives in other regions, and to provide advice and expertise as and where needed. Similarly, IHO has confirmed its endorsement of the project, and appears ready to maintain its association with the activity.
To ensure IBCAO's continuing viability, it has long been appreciated that the project requires a stable base of operations, complemented by a core of dedicated individuals who will assume responsibility for maintaining the data base, for updating the grid and map products, and for ensuring their timely distribution. Thanks to the vision and generosity of CCOM/JHC and allied organizations such as NGDC, the primary fulfilment of these requirements appears to be relatively secure for the near term, however Editorial Board members were advised against complacency, and encouraged to take a long-term view concerning future requirements for maintaining IBCAO as a live, dynamic project that will continue to provide an authoritative portrayal of the Arctic seabed.
Provisions were discussed at some length for handling new contributions to the data base, and for incorporating them in future product versions. A preliminary model was developed that attempted to describe the flow of new information into the project data base, to allocate responsibilities for dealing with updates, revisions, etc, and to identify potential events or circumstances that might trigger different phases of the process (Figure 15). While the first two requirements appeared reasonably straightforward to define, the last one proved more difficult to resolve on account of the unpredictable nature and timing of the precipitating factors.
Data and product quality control emerged as critical factors in the development of future IBCAO grids and maps. It was pointed out that for a given data set, basic quality control should realistically be the responsibility of the data originator, who should also be prepared to present metadata when submitting a new data set for inclusion in IBCAO. Satisfying these requirements will substantially facilitate subsequent operations on the data base. Quality control for new grids and maps is normally performed during the revision/production process, but some level of external review is highly desirable before these products are fully released in the public domain. It was agreed that members of the Editorial Board are well qualified to serve as product reviewers, and that their feedback will be sought when new grids and maps need to be reviewed.
It was acknowledged that IBCAO activities have benefited enormously from the volunteer efforts of enthusiastic individuals, and from in-kind contributions of generous organizations. Nevertheless, these will always need to be supplemented by a certain level of funding to support exchange visits, attendance at meetings, etc. In past and current years, project activities have been sustained by a series of fiscal contributions from various organizations: IASC, IOC, Swedish organizations (Stockholm University, Natural Science Research Council, Polar Secretariat, Ymer-80 Foundation), US organizations (Office of Naval Research, Polar Research Board), and the Canadian Hydrographic Service. Efforts will continue to attract at least moderate amounts of funding from these and similar sources. In light of IBCAO's high level of acceptance by the Arctic research community, it was suggested that the US National Science Foundation might be receptive to a proposal for a more substantial level of funding, and it was agreed that this option was worth investigating.
As reported at the beginning of the meeting, the IBCAO project is being touted by IOC as a model for future bathymetric compilations. At the 2000 meeting of the IOC Executive Council, a proposal was accepted to develop the International Bathymetric Chart of the South East Pacific Ocean (IBCSEPO) along similar lines; a meeting has been scheduled for early October 2001in Valparaiso, Chile, to consider the feasibility of this activity, and to develop a project plan. In the meantime, a suggestion has been advanced to undertake a parallel initiative in the South Atlantic Ocean; this will be pursued in the coming months to gauge potential levels of interest in the region, and if warranted, to prepare a proposal for consideration at next year's meeting of the IOC Executive Council.

Figure 15. A preliminary model was developed that attempted to describe the flow of new information into the project data base, to allocate responsibilities for dealing with updates, revisions, etc, and to identify potential events or circumstances that might trigger different phases of the process.
CLOSE OF MEETING
Participants agreed provisionally that the next meeting of the Editorial Board would take place in the fall of 2002, in a location to be decided. The Chairman thanked the managers of CCOM/JHC for the use of their facilities and for the logistical support in staging the meeting. He expressed appreciation for assistance received from IASC, IOC, and the US Polar Research Board, in providing travel support to participants who might otherwise not have been able to attend. He thanked David Divins, who had cheerfully agreed to take notes on the proceedings. Finally, he thanked all participants for their lively and enthusiastic participation in the discussions, and declared the meeting closed at 1400 on Monday May 28.
BIBLIOGRAPHY
Jakobsson, M., Cherkis, N., Woodward, J., Coakley, B., and Macnab, R., 2000, A new grid of Arctic bathymetry: A significant resource for scientists and mapmakers, EOS Transactions, American Geophysical Union, v. 81, no. 9, p. 89, 93, 96.Head Department of Navigation and Oceanography, All-Russian Research Institute for Geology, and Mineral Resources of the World Ocean, and Russian Academy of Sciences, 1999, Bottom relief of the Arctic Ocean: Head Department of Navigation and Oceanography, St. Petersburg, map, scale 1:5,000 000, 1 sheet.
Wessel, P., and Smith, W. H. F., 1991, Free software helps map and display data: EOS, Transactions, American Gephysical Union, v. 72, no. 41, p. 441, 445-446.
APPENDIX A: ACRONYMS AND ABBREVIATIONS
APPENDIX B: AGENDA
OPENING FORMALITIES
PRESENTATIONS AND RELATED DISCUSSIONS (MAX 15 MIN EACH)
1. Reviews of recent accomplishments
2. New data sets
3. Prospects for future data sets
4. Work in progress and planned
5. Other IBCAO-related investigations
ROUND TABLE DISCUSSION
IBCAO version 1.0 (grid and printed map)
The future of IBCAO
Project management and operating structure
Data management and updates
Quality control of IBCAO data
Funding
Porting the IBCAO project model to other regions
CLOSE OF THE MEETING
APPENDIX C: PARTICIPANTS
THIRD MEETING OF THE EDITORIAL BOARD OF THE IASC/IOC/IHO
INTERNATIONAL BATHYMETRIC CHART OF THE ARCTIC OCEAN (IBCAO)
May 27-28
Center for Coastal and Ocean Mapping/Joint Hydrographic Center
University of New Hampshire


APPENDIX C: MEMBERS OF THE EDITORIAL BOARD OF IBCAO
May, 2001