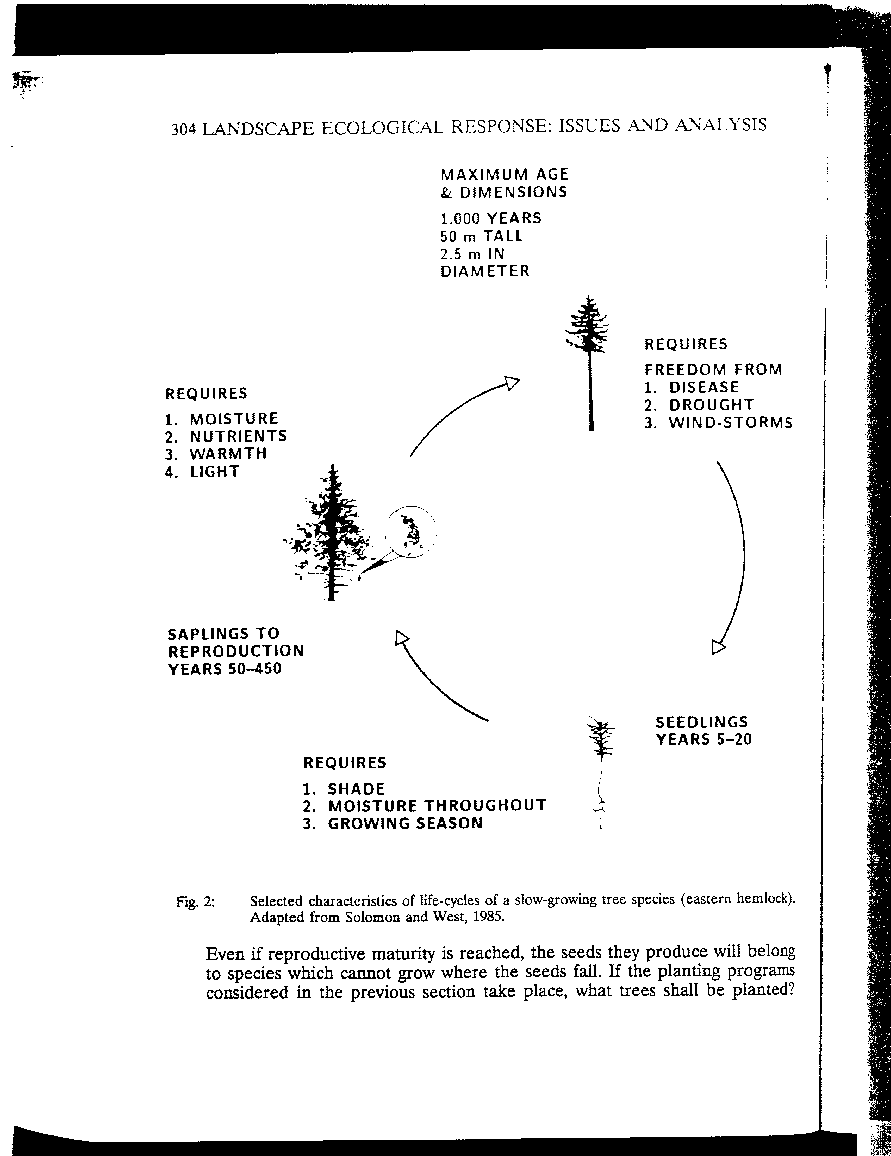
National Oceanic and Atmospheric Administration (NOAA), National Environmental Satellite, Data, and Information Service(NESDIS)


This directory contains the documentation on Leemans and Cramer's IIASA Mean Monthly Temperature, Precipitation, and Cloudiness, reproduced from the Global Ecosystems Database:
*LEEMANS & CRAMER IIASA CLIMATE_help
Global Ecosystems Database Disc A: Chapter 3
Leemans and Cramer IIASA Mean Monthly Values of Temperature,
Precipitation, and Cloudiness on a Global Grid
Average Month Surface Air Temperature
Average Month Precipitation (uncorrected)
Average Month "Cloudiness" (% sunshine)
DATA-SET DESCRIPTION
Data-Set Name: Leemans and Cramer IIASA Mean Monthly Values of
Temperature, Precipitation, and Cloudiness on a
Global Grid
Principal Investigator: Rik Leemans and Wolfgang P. Cramer
International Institute for Applied Systems
Analysis
Scientific Reference: (* reprint on CD-ROM)
+ Leemans, R. and W.P. Cramer, 1991. The IIASA database for
mean monthly values of temperature, precipitation and
cloudiness of a global terrestrial grid. Research
Report RR-91-18 November 1991, International Institute
of Applied Systems Analyses, Laxenburg. 61pp.
SOURCE
Source Data Citation:
Leemans, R., and W.P. Cramer. 1991. The IIASA Database for
Mean Monthly Values of Temperature, Precipitation, and
Cloudiness on a Global Terrestrial Grid. Digital Raster
Data on a 30 minute Geographic (lat/long) 360x720 grid.
Laxenburg, Austria: IIASA. 9-track tape, 10.3 MB
Contributor:
Dr. Rik Leemans
National Institute of Public Health and Environmental
Protection, RIVM
P.O. Box 1
NL-3720 BA Bilthoven, The Netherlands
(31)30-749111
Distributor:
IIASA and RIVM
Vintage:
circa 1990
Lineage:
(1) Published records from 1931 to 1960 (see ORIGIN)
(2) Data integrated from multiple sources at IIASA (Leemans
and Cramer)
ORIGINAL DESIGN
Variables:
(1) Average Monthly Surface Temperature, converted to C
(precision=.1C)
(2) Monthly Average Precipitation (interpolation of
measured values), uncorrected for rain-gauge bias.
(3) "Cloudiness," expressed as percentage sunshine hours of
potential hours per month at the land surface.
Origin:
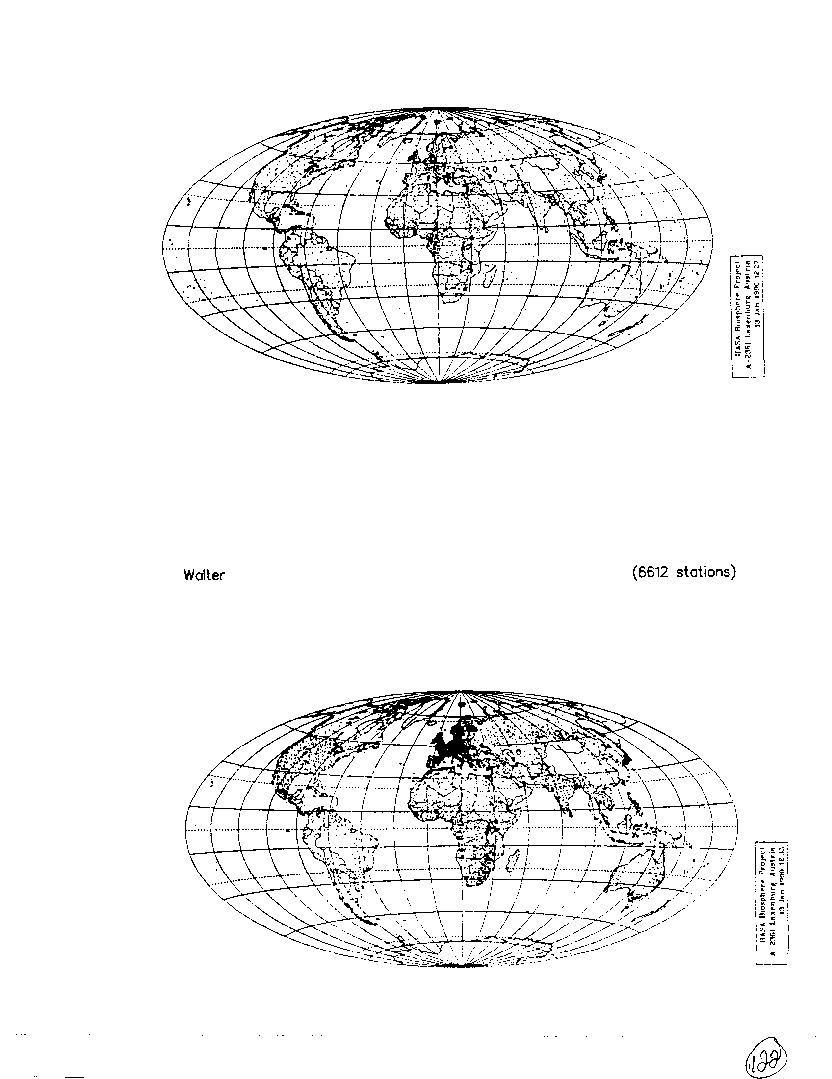
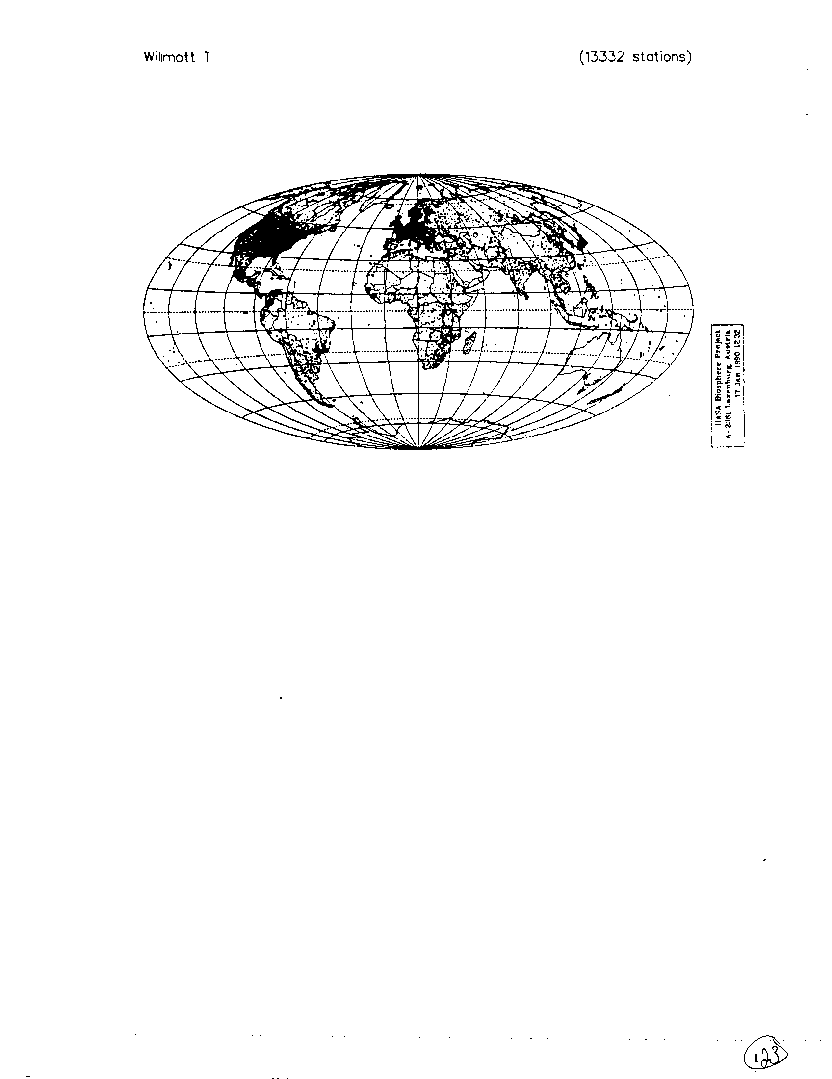
Weather records from the following sources (see Scientific
Reference):
1) World Weather Records, U.S. Weather Bureau.
2) The Climate Atlas of Walter and Lieth
3) M|ller: Selected Climatic Data for Vegetation Science,
based on:
a) UK Meteorological Office records
b) World Survey of Climatology (Landsberg)
4) Bradley: Precipitation and Temperature Data for the
Northern Hemisphere
5) Selected weather data for Europe from the UK
Meteorological Office
6) Thornthwait and Mather's Temperature & Precipitation data.
7) Soviet Temperature and Precipitation data (Siberia)
8) Chinese Temperature and Precipitation data (NE China)
Geographic Reference:
latitude/longitude
Geographic Coverage:
Global
Maximum Latitude: +90 degrees (N)
Minimum Latitude: -90 degrees (S)
Maximum Longitude: +180 degrees (E)
Minimum Longitude: -180 degrees (W)
Geographic Sampling:
30-minute cell values interpolated from station observations
using spatial model (see Leemans and Cramer, 1992; pgs. 13-14).
Time Period:
"current climate" (or "normal climate") as characterized from
1931-1960
Temporal Sampling:
long-term means for each month composited from available
records.
INTEGRATED DATA-SET
Data-Set Citation:
Leemans, R., and W.P. Cramer. 1992. IIASA Database for
Mean Monthly Values of Temperature, Precipitation, and
Cloudiness on a Global Terrestrial Grid. Digital Raster
Data on a 30 minute Geographic (lat/long) 360x720 grid.
In: Global Ecosystems Database Version 1.0: Disc A.
Boulder, CO: NOAA National Geophysical Data Center.
36 independent single-attribute spatial layers on CD-
ROM, 15.6MB. [first published in 1991]
Analyst:
Mark A. Ohrenschall
Projection:
Geographic (lat/long), GED window (see User's Guide).
Spatial Representation:
Characteristic values for 30-minute cells, from a spatial
model based on irregularly located station data.
Temporal Representation:
Characteristic months of average climate for 1931-1960 (a
relatively stable period).
Data Representation:
1) Temperature: 2-byte integers, representing surface air
temperature in 1/10th degrees Celsius (or degrees x 10).
2) Precipitation: 2-byte integers, representing average
monthly precipitation in millimeters (uncorrected)
3) Cloudiness: 1-byte integers, representing percentage
sunshine hours of potential hours per month (0-100).
Layers and Attributes:
36 independent single-attribute spatial layers
Compressed Data Volume:
2,260,638 bytes
ADDITIONAL REFERENCES
Monserud, R.A. and Leemans, R. 1992. The comparison of
global vegetation maps. Ecol. Modelling (in press).
Prentice, I.C., Cramer, W., Harrison, S.P, Leemans, R.,
Monserud, R.A. & Solomon, A.M. 1992. A global biome
model based on plant physiology and dominance, soil
properties and climate. J. Biogeography (in press).
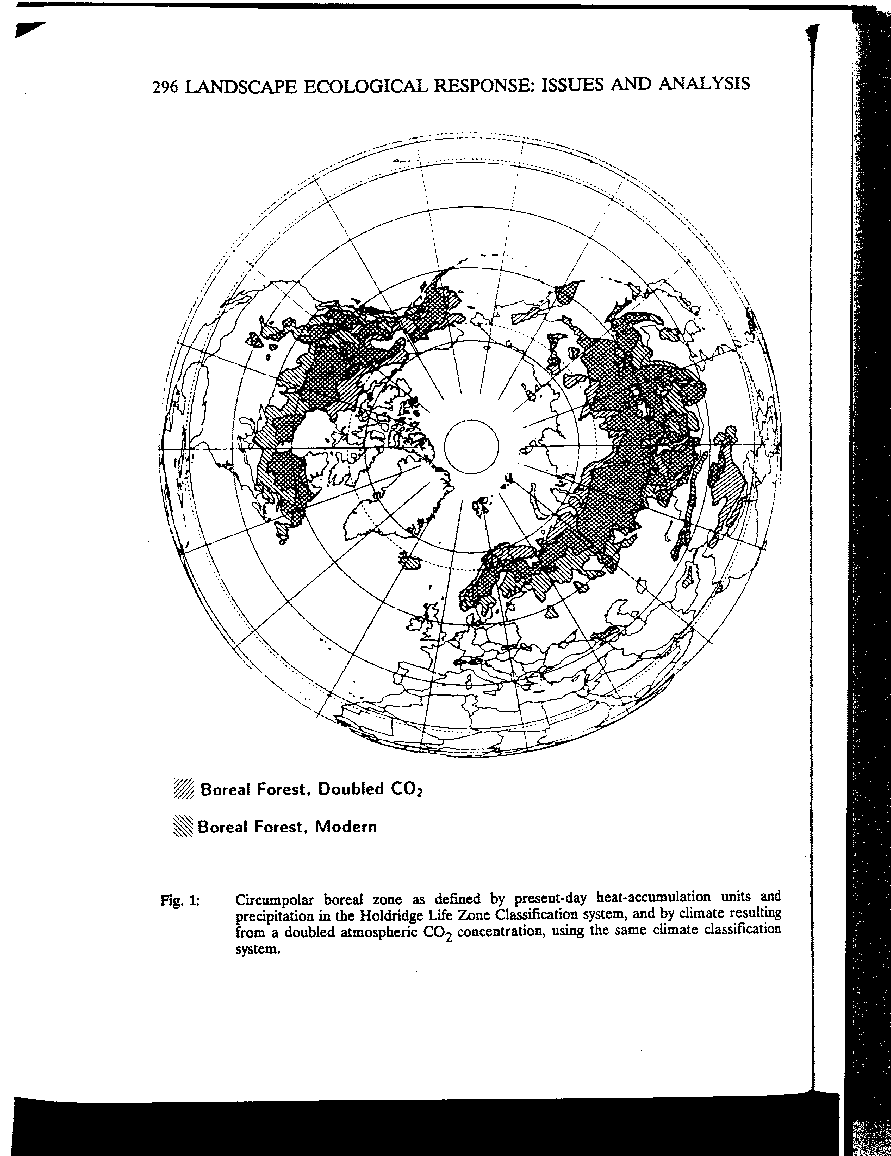
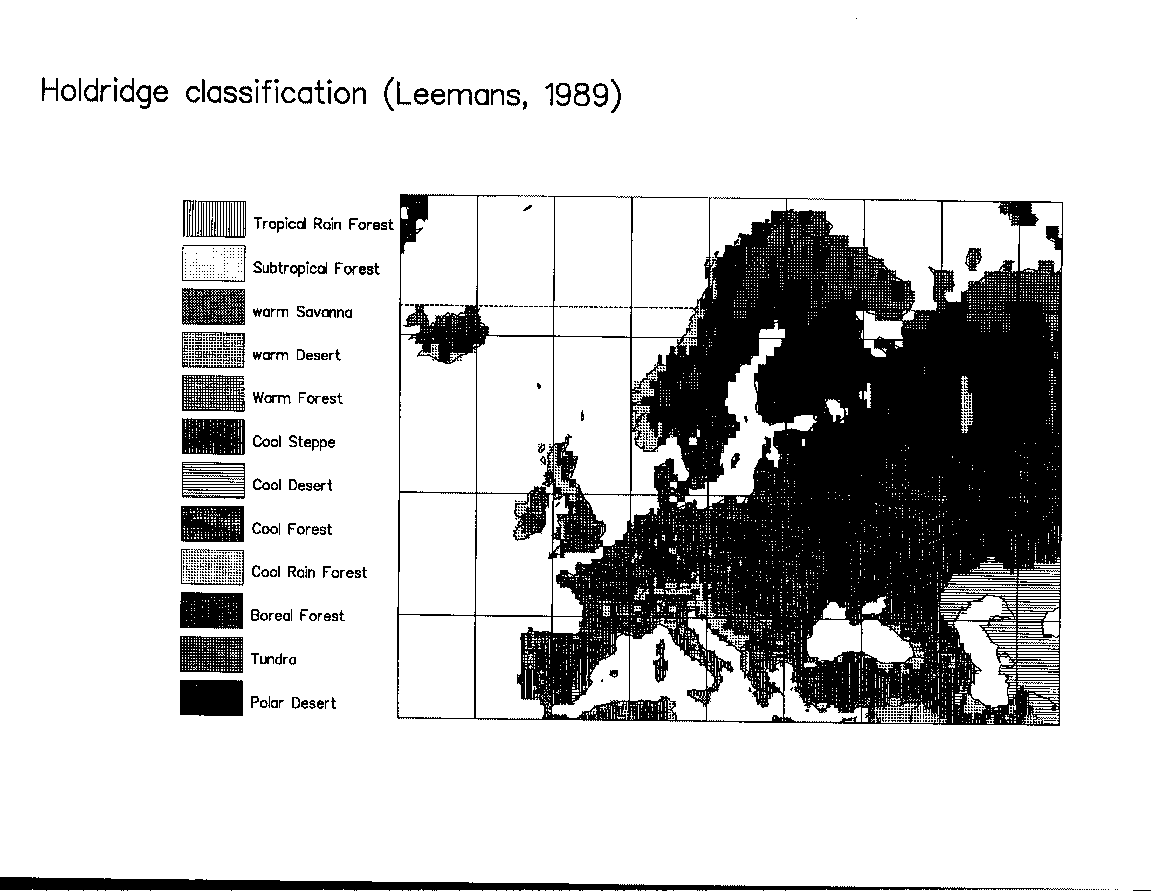
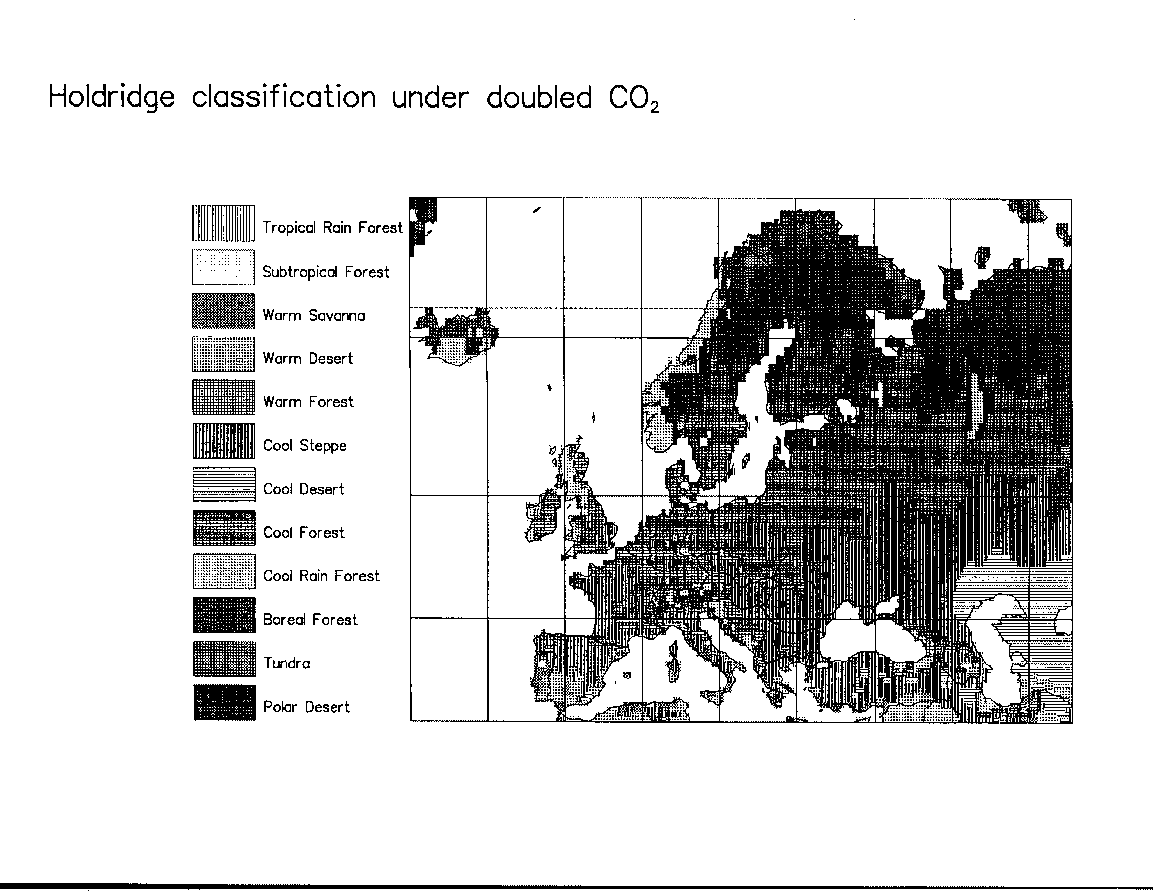
Solomon, A.M. and R. Leemans. 1990. Climatic change and
landscape-ecological response: Issues and analyses. In:
Boer, M.M. and de Groot, R.S. (eds.), Landscape
Landscape Ecological Impact of Climatic Change. IOS
Press, Amsterdam. pp. 293-316 (ISBN 90 5199 023 5).
TECHNICAL REPORT
Mark A. Ohrenschall
NOAA National Geophysical Data Center
Boulder, Colorado
The source data were in lat/long projection at 0.5-degree
resolution. The source files were in a ASCII record format, with
ocean cells omitted. Each data file had a header line containing
two different FORTRAN format statements, followed by fixed-length
data records containing latitude and longitude in tenths of
degrees, referencing the south-west corner of the grid cell,
followed by that cell's twelve monthly values.
A raster data file was created for each month for each parameter,
setting the background to a no-data flag and a program was
written to read in grid values from the source files. Results
were checked by spot-checking individual grid points.
The original data structure was compatible with the GED grid
conventions, and no changes were made in the original data
values, numerical type, or precision.
The data were inspected to verify that there were no obvious
artifacts and to spot check the final integrated data against the
original source. Some comparisons were made with other data-sets
in the database, e.g., the Legates and Willmott data, finding
some discrepancies. In particular, comparison with local
patterns (e.g., near Mexico) indicated potentially large
differences due to variable surface conditions. Otherwise, the
data appear to be representative of broad-scale patterns, and
reviewers noted that it may provide better resolution than the
Legates and Willmott data.
*LEEMANS & CRAMER IIASA CLIMATE
ANCILLARY ENVIRONMENTAL DATA
Avg Month Air Temp #*AVG MONTH AIR TEMP
Avg Month Precip #*AVG MONTH PRECIP
Avg Month "Cloudiness" #*AVG MONTH "CLOUDINESS"
Scanned Documentation #*LC SCANNED DOCUMENTATION
*LC SCANNED DOCUMENTATION_help
"Hints on Scanned Documentation"
The scanned documentation noted here is contained in the \document
directory on the CD-ROM as .gif files. These files can be read by
any computer program that reads PC Paintbrush format files.
The GeoVu software provided on this CD-ROM contains such a utility.
To use the GeoVu utility, merely select the appropriate file from
this menu, using the "Open Data" option that you have been using to
this point.
If you are VERY NEW to GeoVu, you can open a file by
1. Selecting "File" from the options at the top of your screen.
2. After selecting "File" select "Open Data" from the options that
appear in the pull-down menu.
3. Follow the hierarchy of menu paths to the data of your choice.
4. When the hierarchy leads you to a topic "Scanned Documentation"
merely select that topic. The next topic should read "Page 1, Page
2,... etc." or "Paper 1 Page 1, Paper 1 Page 2, .... Paper 2 Page
1.... etc. You can select the pages manually, or create a "slide
show" under the Utilities option at the top of the screen. The first
time the .gif file displays it might be reduced in size. This is a
"feature" of current versions of GeoVu that might be improved in the
future. If you redisplay the image (by selecting "Search" from the
options at the top of the screen, then "Create" from the menu thus
pulled down, you can modify the parameter that sets the sampling
rate from "n" [usually 2, 3, 4, or 5] to 1). This will give you full
resolution display of the scanned documentation.
It should be noted that this scanned documentation is a compromise.
We originally attempted to use optical character recognition
software to convert the scanned documentation to more usable text.
However, the technology was too immature at the time of scanning
(1992) to use successfully. Indeed, as of this writing (late 1995)
the technology is still too immature for convenient application to
this problem.
Thus, we present the scanned documentation as images.
NOTE: Many of the original documents are not copyright, and may be
reproduced freely. However, several other documents ARE copyright.
The National Geophysical Data Center has obtained permission to
reproduce all documents with a valid copyright. However, this
permission does not pass automatically to anyone else. Thus, though
all of the data on this CD-ROM are unrestricted, much of the scanned
documentation (which contains copyright notices) may not be
distributed further, without permission of the copyright holder, or
without a dontribution made to the Copyright Clearance Center under
the rules noted in the individual papers. (Also note that a few
documents authored by U. S. Government employees or contractors as
part of their work for the Government, had copyrights claimed by the
journals that published the papers. Such documents are not subject
to copyright, and the copyright claims of said journals have been
determined to be meritless.)
*LC SCANNED DOCUMENTATION
LEEMANS & CRAMER IIASA CLIMATE
*AVG MONTH AIR TEMP_help
DATA ELEMENT:       Average Month Surface Air Temperature

STRUCTURE:
     Raster Data Files:  0.5-degree 360x720 GED grid
     (see User's Guide)

SERIES:
     series of 12 characteristic months

SPATIAL META-DATA:
LCTMP01.DOC
file title  : Leemans and Cramer January Temperature (0.1C)
data type   : integer
file type   : binary
columns     : 720
rows        : 360
ref. system : lat/long
ref. units  : deg
unit dist.  : 1.0000000
min. X      : -180.0000000
max. X      : 180.0000000
min. Y      : -90.0000000
max. Y      : 90.0000000
pos'n error : unknown
resolution  : 0.5000000
min. value  : -583
max. value  : 406
value units : 0.1 degrees Celsius
value error : unknown
flag value  : -999
flag def'n  : flag value -999 indicates no data
legend cats : 0

File Series Parameters:
File      Month   Minimum   Maximum
LCTMP01:  January   -583      406
LCTMP02:  February  -546      413
LCTMP03:  March     -512      423
LCTMP04:  April     -430      432
LCTMP05:  May       -284      434
LCTMP06:  June      -223      429
LCTMP07:  July      -222      441
LCTMP08:  August    -214      423
LCTMP09:  September -272      426
LCTMP10:  October   -371      423
LCTMP11:  November  -445      420
LCTMP12:  December  -533      417

ATTRIBUTE META-DATA:
NONE

NOTES:
     (1)  units are in 1/10th degrees Celsius
*AVG MONTH AIR TEMP
LEEMANS & CRAMER IIASA CLIMATE
January #\data\ncillary\lctmp01.img
February #\data\ncillary\lctmp02.img
March #\data\ncillary\lctmp03.img
April #\data\ncillary\lctmp04.img
May #\data\ncillary\lctmp05.img
June #\data\ncillary\lctmp06.img
July #\data\ncillary\lctmp07.img
August #\data\ncillary\lctmp08.img
September #\data\ncillary\lctmp09.img
October #\data\ncillary\lctmp10.img
November #\data\ncillary\lctmp11.img
December #\data\ncillary\lctmp12.img
*AVG MONTH PRECIP_help
DATA ELEMENT:       Average Month Precipitation (uncorrected)

STRUCTURE:
     Raster Data File:.5-degree 360x720 GED grid (see User's Guide)

SERIES:
     series of 12 characteristic months

SPATIAL META-DATA:
LCPRC01.DOC
file title  : Leemans and Cramer January Precipitation (mm/mth)
data type   : integer
file type   : binary
columns     : 720
rows        : 360
ref. system : lat/long
ref. units  : deg
unit dist.  : 1.0000000
min. X      : -180.0000000
max. X      : 180.0000000
min. Y      : -90.0000000
max. Y      : 90.0000000
pos'n error : unknown
resolution  : 0.5000000
min. value  : 0
max. value  : 942
value units : millimeters/month
value error : unknown
flag value  : -999
flag def'n  : flag value -999 indicates no data
legend cats : 0

File Series Parameters:
File      Month   Minimum   Maximum
LCPRC01:  January    0        942
LCPRC02:  February   0        652
LCPRC03:  March      0        830
LCPRC04:  April      0        676
LCPRC05:  May        0        1280
LCPRC06:  June       0        2695
LCPRC07:  July       0        2774
LCPRC08:  August     0        1950
LCPRC09:  September  0        1106
LCPRC10:  October    0        863
LCPRC11:  November   0        914
LCPRC12:  December   0        743

ATTRIBUTE META-DATA:
NONE

NOTES:
*AVG MONTH PRECIP
LEEMANS & CRAMER IIASA CLIMATE
January #\data\ncillary\lcprc01.img
February #\data\ncillary\lcprc02.img
March #\data\ncillary\lcprc03.img
April #\data\ncillary\lcprc04.img
May #\data\ncillary\lcprc05.img
June #\data\ncillary\lcprc06.img
July #\data\ncillary\lcprc07.img
August #\data\ncillary\lcprc08.img
September #\data\ncillary\lcprc09.img
October #\data\ncillary\lcprc10.img
November #\data\ncillary\lcprc11.img
December #\data\ncillary\lcprc12.img
*AVG MONTH "CLOUDINESS"_help
DATA ELEMENT:       Average Month "Cloudiness" (% sunshine)

STRUCTURE:
     Raster Data File:0.5-degree 360x720 GED grid (see User's Guide)

SERIES:
     series of 12 characteristic months

SPATIAL META-DATA:
LCCLD01.DOC
file title  : Leemans and Cramer January Cloudiness (% Sunshine)
data type   : byte
file type   : binary
columns     : 720
rows        : 360
ref. system : lat/long
ref. units  : deg
unit dist.  : 1.0000000
min. X      : -180.0000000
max. X      : 180.0000000
min. Y      : -90.0000000
max. Y      : 90.0000000
pos'n error : unknown
resolution  : 0.5000000
min. value  : 0
max. value  : 95
value units : percentage sunshine hours of potential hours per
month
value error : unknown
flag value  : 254
flag def'n  : flag value 254 indicates no data
legend cats : 0

File Series Parameters:
File      Month   Minimum   Maximum
LCCLD01:  January    0         95
LCCLD02:  February   4         94
LCCLD03:  March      9         88
LCCLD04:  April      2         92
LCCLD05:  May        2         95
LCCLD06:  June       0         98
LCCLD07:  July       0        100
LCCLD08:  August     0         98
LCCLD09:  September  0         98
LCCLD10:  October    0         99
LCCLD11:  November   0         96
LCCLD12:  December   0        100

ATTRIBUTE META-DATA:

NONE

NOTES:
     (1)  Regional discrepancies with the FAO climatic database
          have been noted (e.g., Vietnam).
*AVG MONTH "CLOUDINESS"
LEEMANS & CRAMER IIASA CLIMATE
January #\data\ncillary\lccld01.img
February #\data\ncillary\lccld02.img
March #\data\ncillary\lccld03.img
April #\data\ncillary\lccld04.img
May #\data\ncillary\lccld05.img
June #\data\ncillary\lccld06.img
July #\data\ncillary\lccld07.img
August #\data\ncillary\lccld08.img
September #\data\ncillary\lccld09.img
October #\data\ncillary\lccld10.img
November #\data\ncillary\lccld11.img
December #\data\ncillary\lccld12.img