
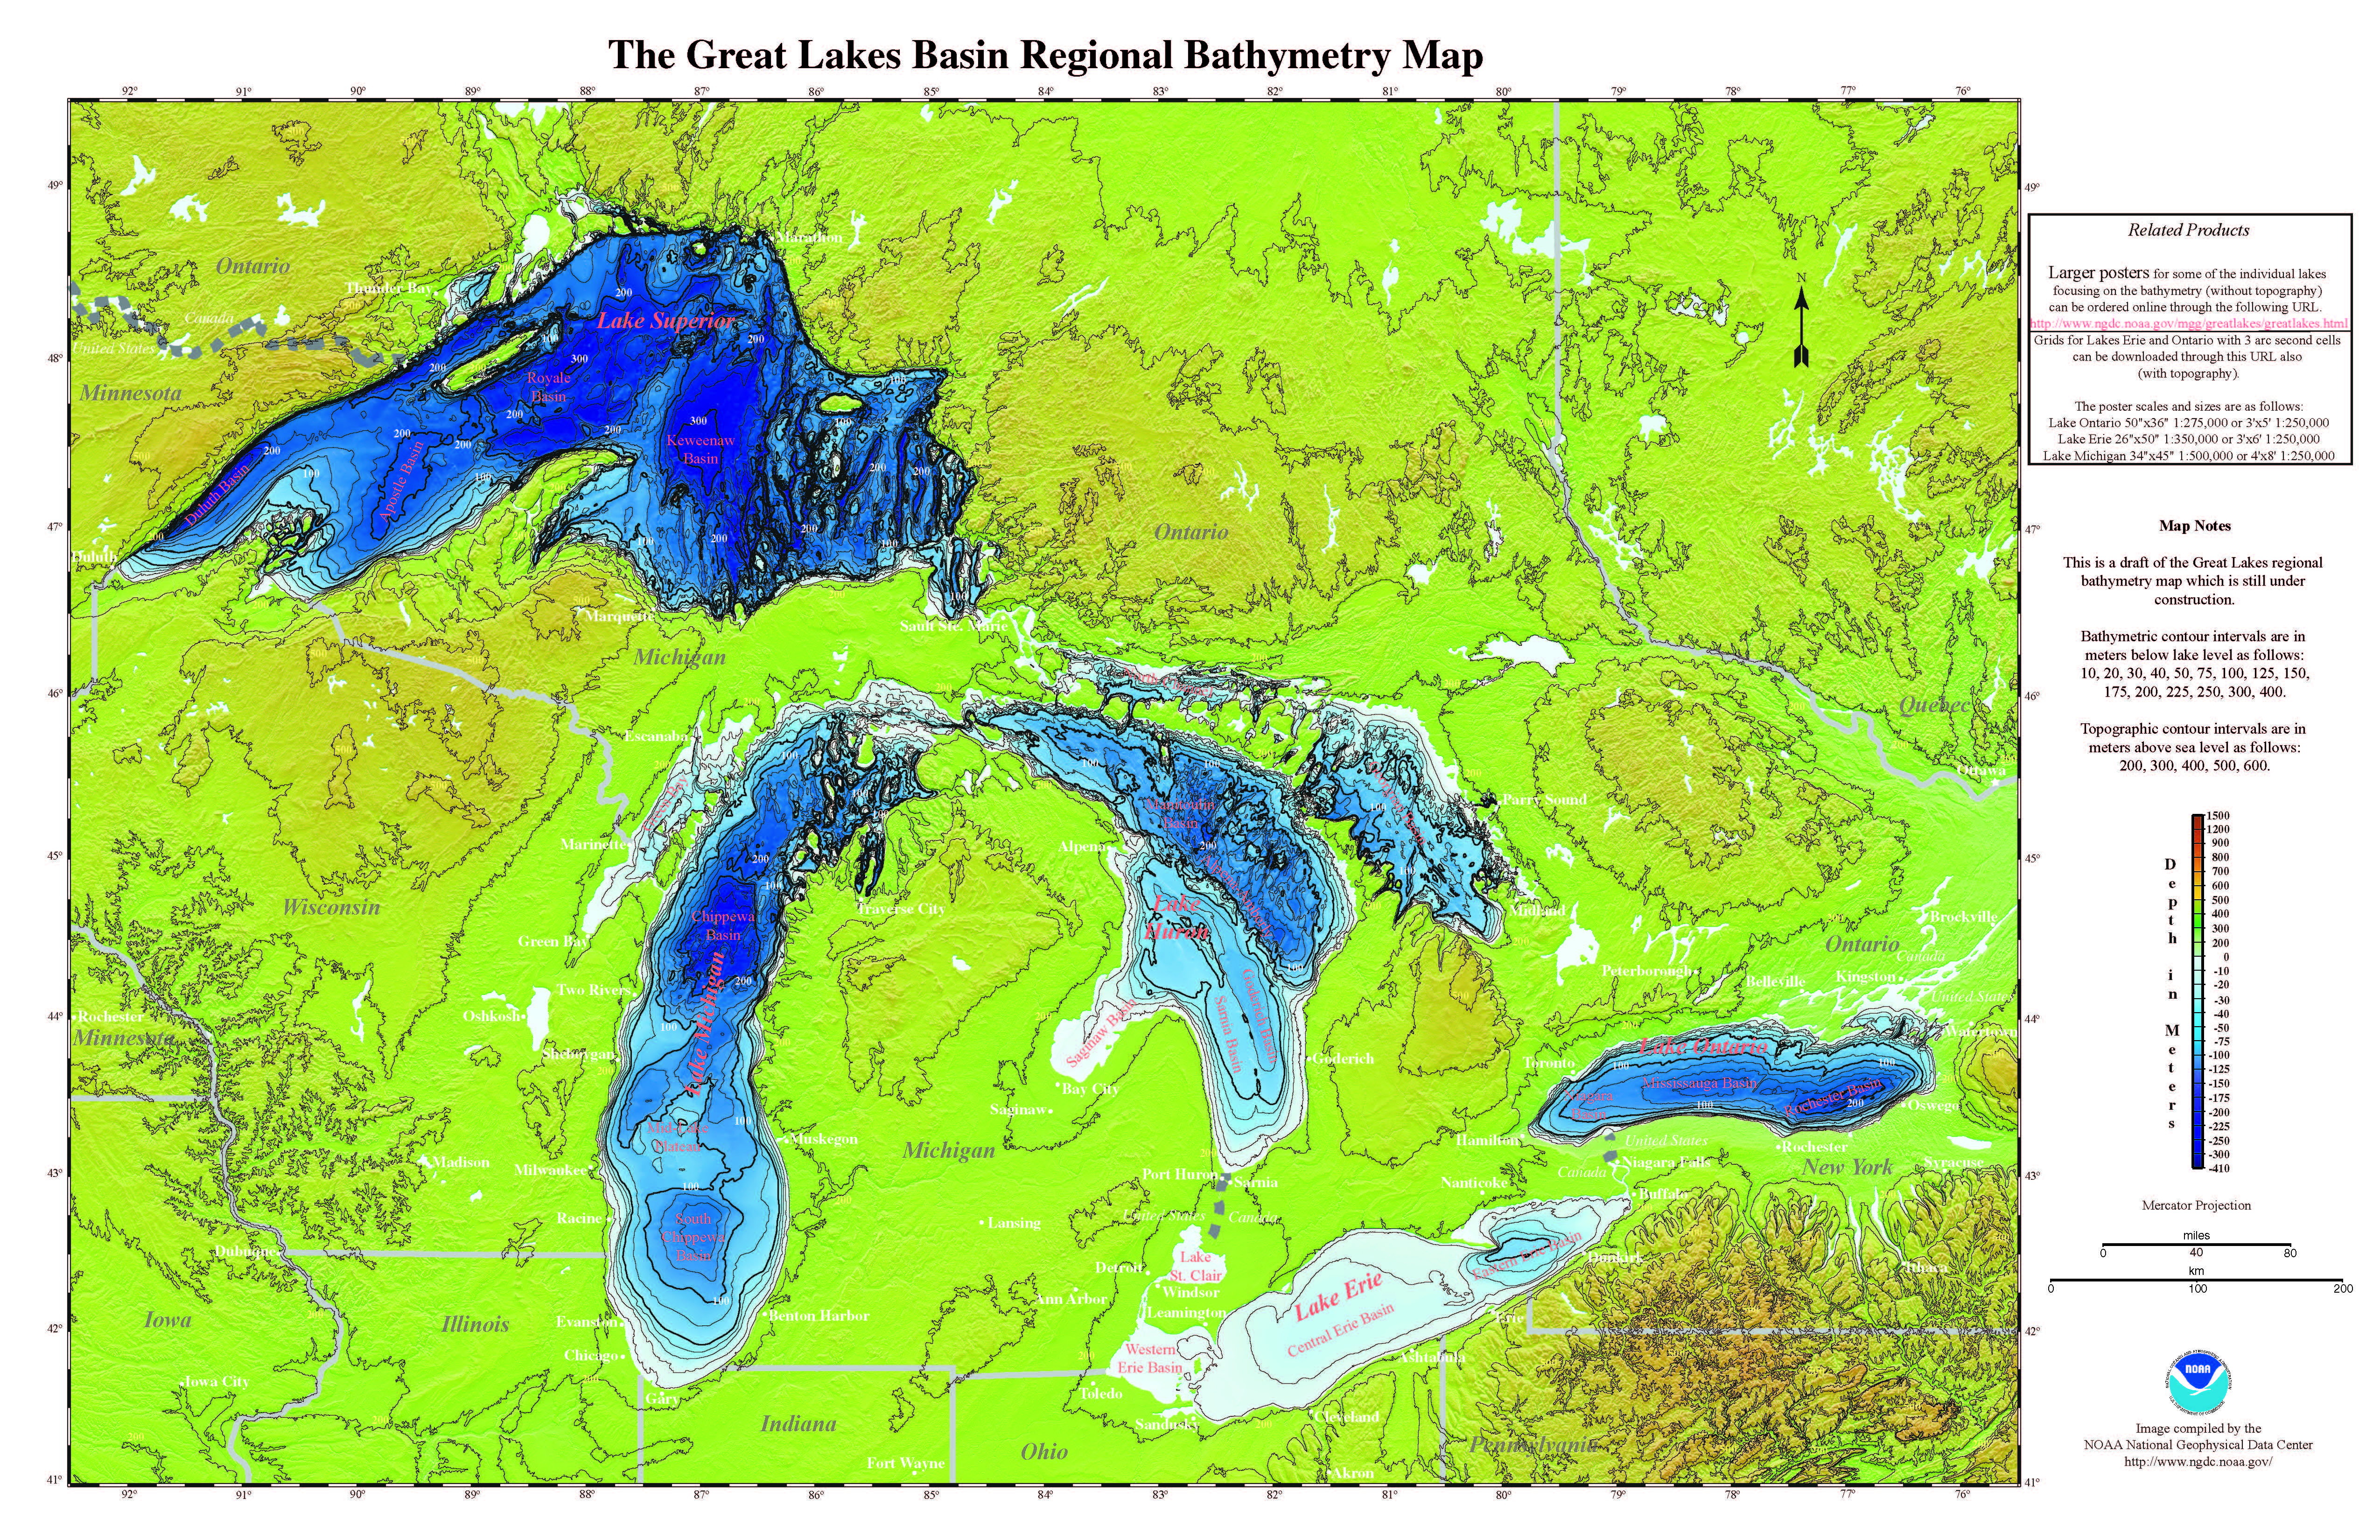
The Great Lakes Bathymetry collection was compiled to rescue lake floor geological and geophysical data for public use. It contains bathymetry and detailed topographic maps for each of the Great Lakes derived from more than 100 years’ worth of soundings collected by the U.S. Army Corp. of Engineers (before 1970), the NOAA National Ocean Service (NOS) (after 1970), the Canadian Hydrographic Service (CHS), and other organizations. These data are an important resource for researchers and local communities concerned with Great Lakes science, pollution, coastal erosion, climate changes, ecosystem threats, and fishing industry health.
Grid Extract
Use the Grid Extract interactive map to create and download spatial subsets of bathymetry from each of the Great Lakes.
Data
- Bathymetry Contours Shapefile
- Standard Grid: ARC ASCII | Binary Float | GeoTiff | NetCDF | GRD98 | XYZ
- Metadata
Citation: National Geophysical Data Center, 1999. Bathymetry of Lake Erie and Lake St. Clair. National Geophysical Data Center, NOAA. doi:10.7289/V5KS6PHK [access date].
About
This dataset is made up of several hundred thousand soundings separated in the existing archives by medium (digital or print) and nation of origin (U.S. or Canada). The final product is a synthesis of data from all four sources. Data control trackline spacing ranges from 500 to 2500 meters for the open lake, and 125 to 500 meters for nearshore areas.
Before contouring, digital soundings were converted to metric units and plotted in color according to depth range. Metric unit contours were generated directly on printed overlays, reduced to compilation scale, and patched in. The compilation sheets were scanned and vectorized to create the digital bathymetric contour data that constitutes the primary product. Geomorphologists rendered the contours by hand to ensure greater accuracy and detail than possible with machine contouring for the available data density. Geologists prepared contours using sounding data from the physical archives (scales from 1:100,000 to 1:10,000) or digital databases (standard scales of either 1:100,000 or 1:50,000). More details about the compilation method can be found in the western Lake Erie paper (Holcombe, et al., 1997). Bathymetric contours have been spatially reconciled with the NOAA Coast Survey nominal scale 1:80,000 digital vector shoreline, which by definition coincides with the Lake Erie low water datum, the zero-depth employed for bathymetric surveys and nautical charting.
Posters
- Small (1291x645px): Images and Geomorphology
- Medium (3888x2592px): 3-D; one meter contour intervals
- Large (4608x2304px)
Illustrations
A set of bathymetry and physiography visualizations created in conjunction with the Lake-Floor Geomorphology of Lake Erie paper (World Data Center A for Marine Geology and Geophysics RP-3, January 2005):
Figure 1: Small scale bathymetry for both lakes
Figure Legend
- A: Bathymetry of Lake Erie and Lake St. Clair
- B. Bathymetric data coverage of Lake Erie
- C: Physiography of the Islands and Sandusky Basin area of western Lake Erie in 3-D perspective
- D: Bathymetry of the extreme eastern end of Lake Erie off Buffalo, New York
- E: Bathymetry of Lake St. Clair
- F: Bathymetry of the Long Point - Erie Ridge, Clear Creek Ridge, Pennsylvania Ridge and Channel, and adjacent features
- G: Physiography of the Long Point - Erie Ridge area, and the surrounding land areas, in 3-D perspective
- H: Bathymetry of the north shore of Lake Erie east of Long Point
Other Figures
- Index map of Lake Erie geographic feature names: Eastern | Western
- Areas of bedrock outcrops in Lake Erie
- Outer limits and maximum depths of the steep wave-cut shore zone of the perimeter of Lake Erie and its islands
- Moraines occurring on the Lake Erie lake floor
- Postglacial depositional features
- Section lines for topographic sections along crest lines of Clear Creek and Long Point - Erie Ridges
- Longitudinal section along the crest line of Clear Creek Ridge
- Longitudinal section along the crest line of Long Point - Erie Ridge
- How Long Point - Erie Ridge and Clear Creek Ridge may have evolved in postglacial time
Data
- Bathymetry Contours Shapefile
- Standard Grid: ARC ASCII | Binary Float | GeoTiff | NetCDF | GRD98 | XYZ
- Metadata
Citation: National Geophysical Data Center, 1999. Bathymetry of Lake Huron. National Geophysical Data Center, NOAA. doi:10.7289/V5G15XS5 [access date].
About
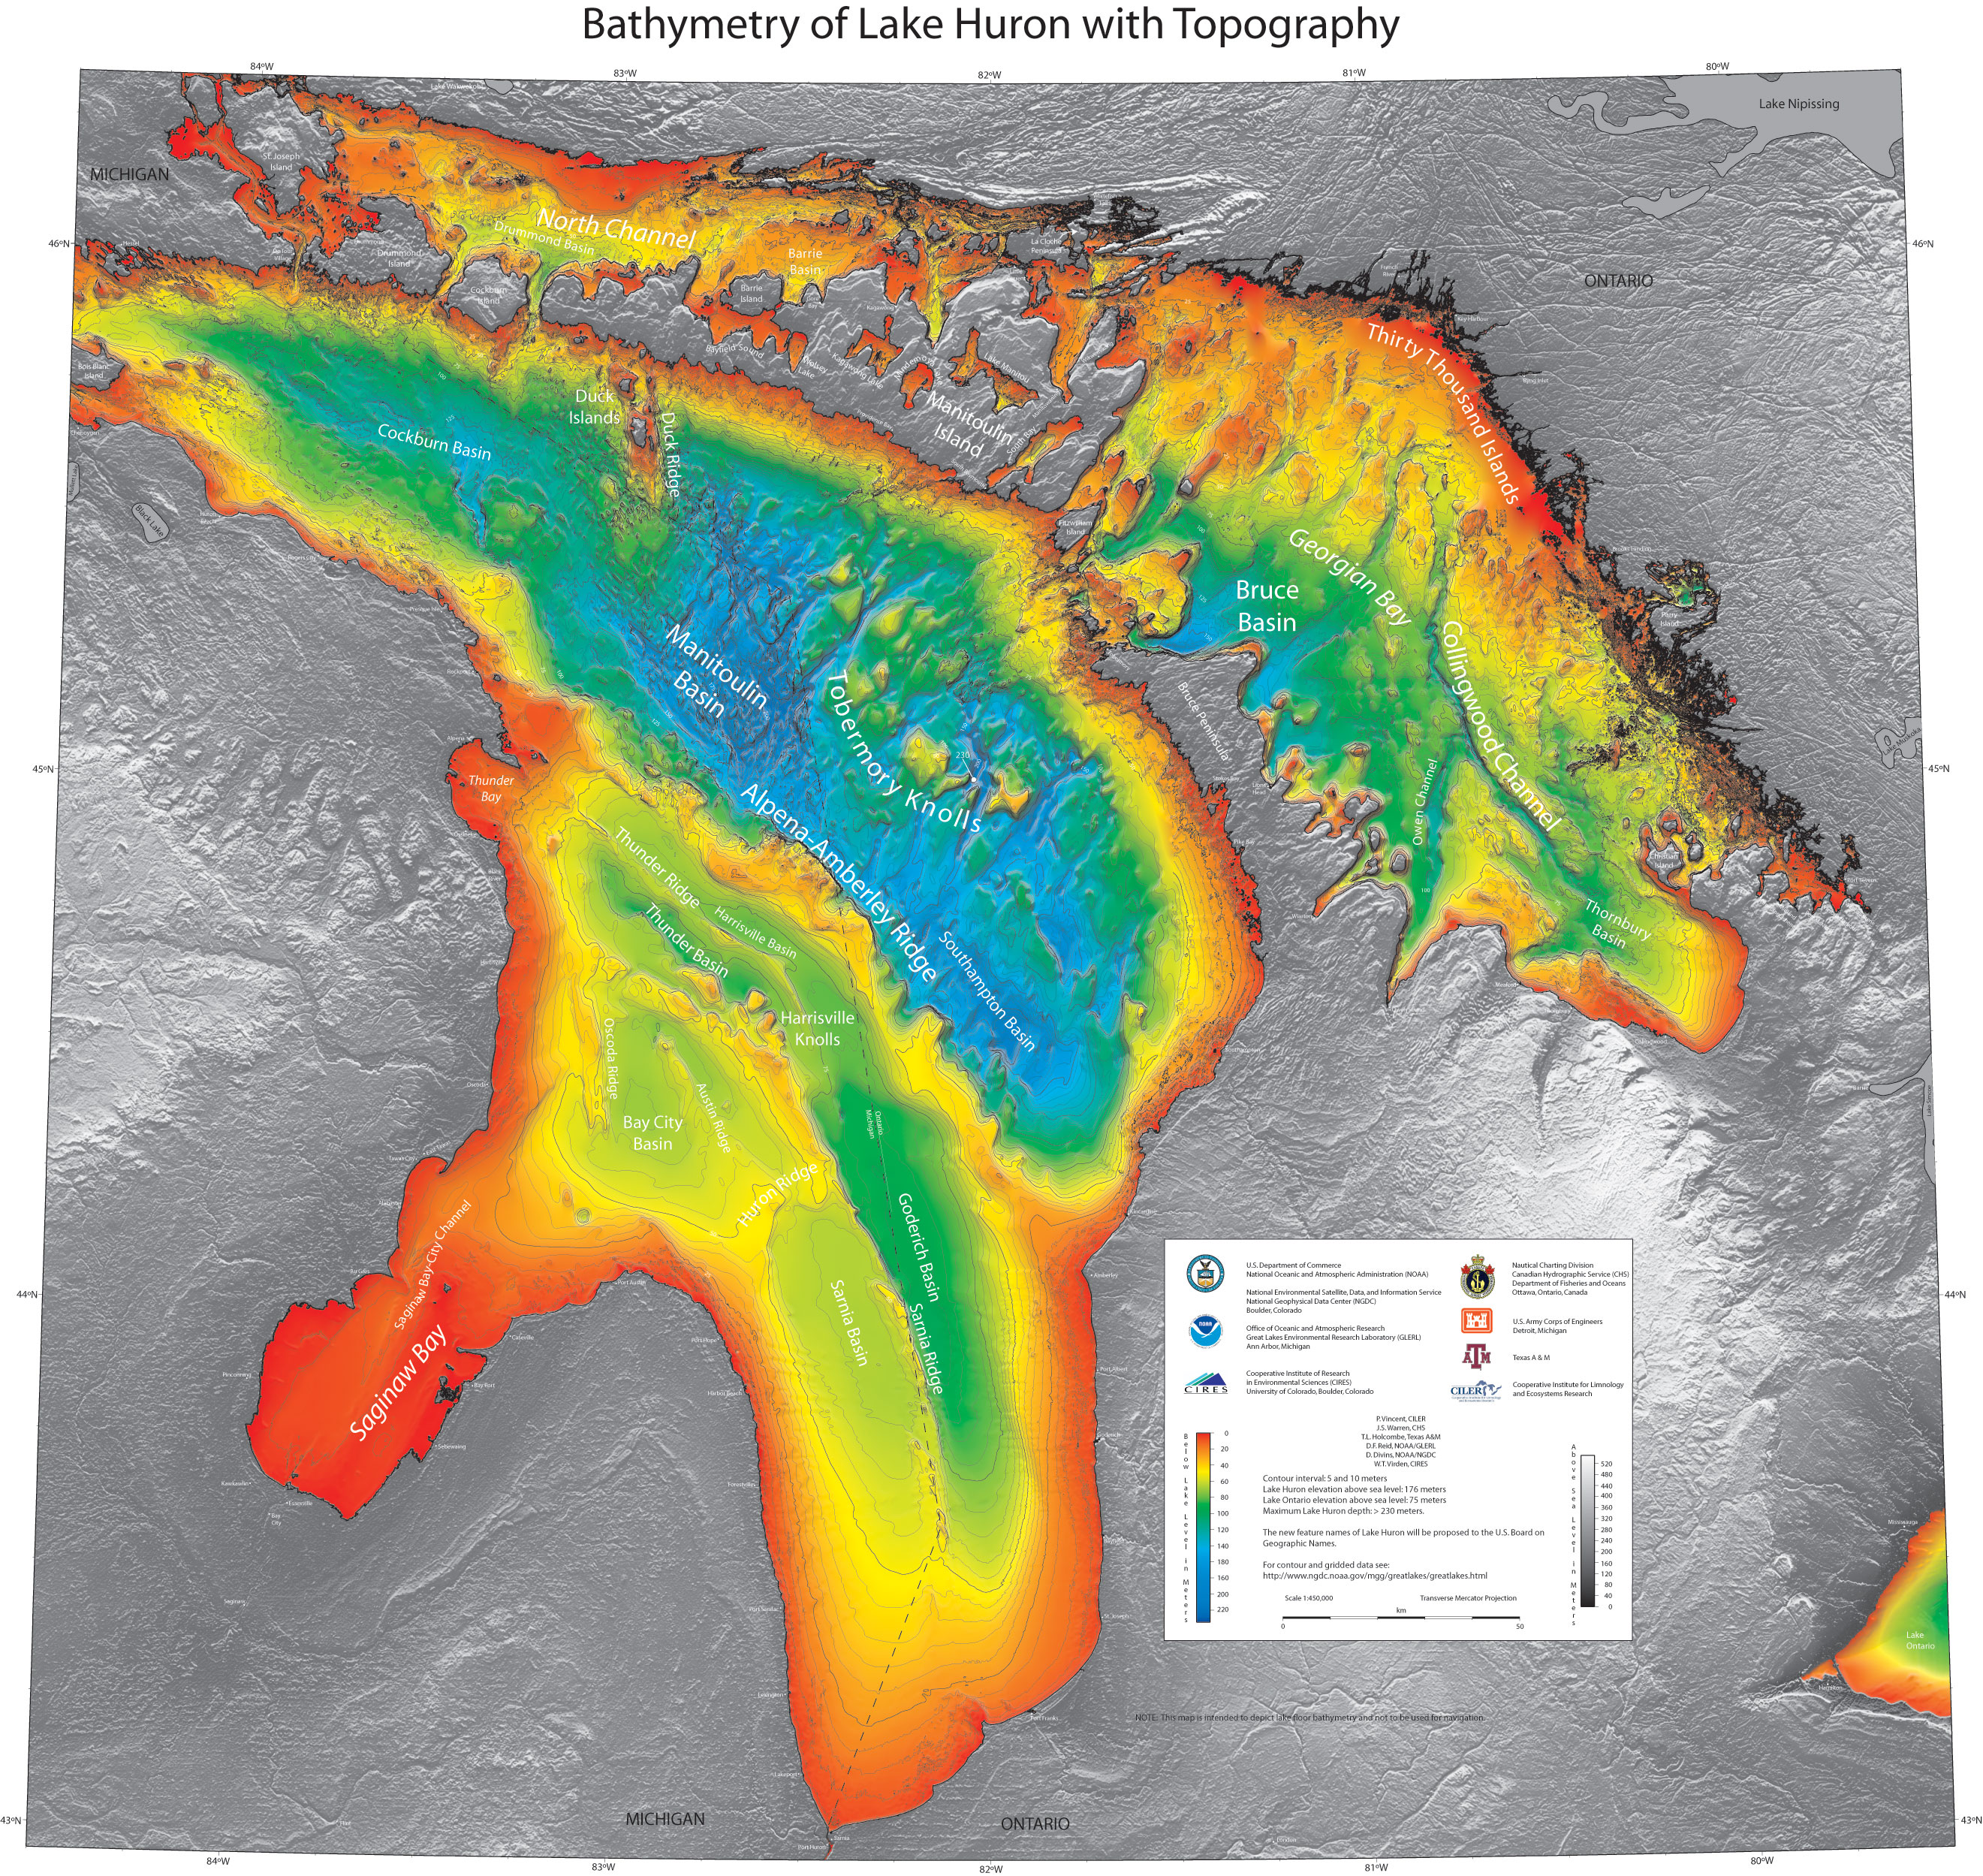
The Lake Huron bathymetry provides a detailed look at the lake floor topography and serves as a GIS base layer for many applications.
Posters
Bathymetry of Lake Huron with Topography: Medium (641x2498px ) | Large with detailed overlay (3024x2592px)
Data
- Bathymetry Contours Shapefile
- Standard Grid: ARC ASCII | Binary Float | GeoTiff | NetCDF | GRD98 | XYZ
- Metadata
Citation: National Geophysical Data Center, 1996. Bathymetry of Lake Michigan. National Geophysical Data Center, NOAA. doi:10.7289/V5B85627 [access date].
About
This bathymetry was compiled utilizing the entire Lake Michigan historic sounding database (more than 600,000 digital and print soundings) to render previously known features more accurately, and reveal unknown lake floor characteristics for the first time. The data were compiled at a scale of 1:250,000, with 5 meter contour intervals. Trackline density is generally about 2000m for the open lake and ranges from 200m to 600m for nearshore areas. Soundings collected since 1903 were reduced to the Lake Michigan Mean Low Water datum before this project and did not require further calibration, but pre-1903 soundings were retroactively reduced to the mean before being incorporated.
Before contouring, digital soundings were converted to metric units and plotted in color; separate colors were assigned to the various depth ranges. From the paper sheets, contours in metric units were generated directly on overlays; these contours were then reduced to the compilation scale of 1:250,000 and incorporated into the map. Compilation sheets were then scanned and vectorized; and the resulting digital vector bathymetric contour data were used to generate the imagery shown on the large color plate. Images were constructed using the publicly-available software Generic Mapping Tools (GMT).
Posters
- 34x45in: Preview | Order Online
- 1:250,0000 scale: 3 parts (4032x2592px) (PDF): Top | Middle | Bottom
Images and Geomorphology
Images depicting specific features and bathymetry of the Lake Michigan floor.
- Area 1
- Area 2
- Mid Lakes Plateau (Area 3)
- South Chippewa Basin (Area 4)
- Mackinac Channel (5 meter contours) (Area 5)
- Area 6
- Area 7
- Bathymetry of Lake Michigan
- Trackline Density
- Two Rivers Ridge and Door- Leelanau Ridge
- Chippewa Basin
- Whitefish Channel and Submerged Delta
- Ridges and Valleys in the Islands Area
Data
- Bathymetry Contours Shapefile
- Standard Grid: ARC ASCII | Binary Float | GeoTiff | NetCDF | GRD98 | XYZ
- Metadata
Citation: National Geophysical Data Center, 1999. Bathymetry of Lake Ontario. National Geophysical Data Center, NOAA. doi:10.7289/V56H4FBH [access date].
About
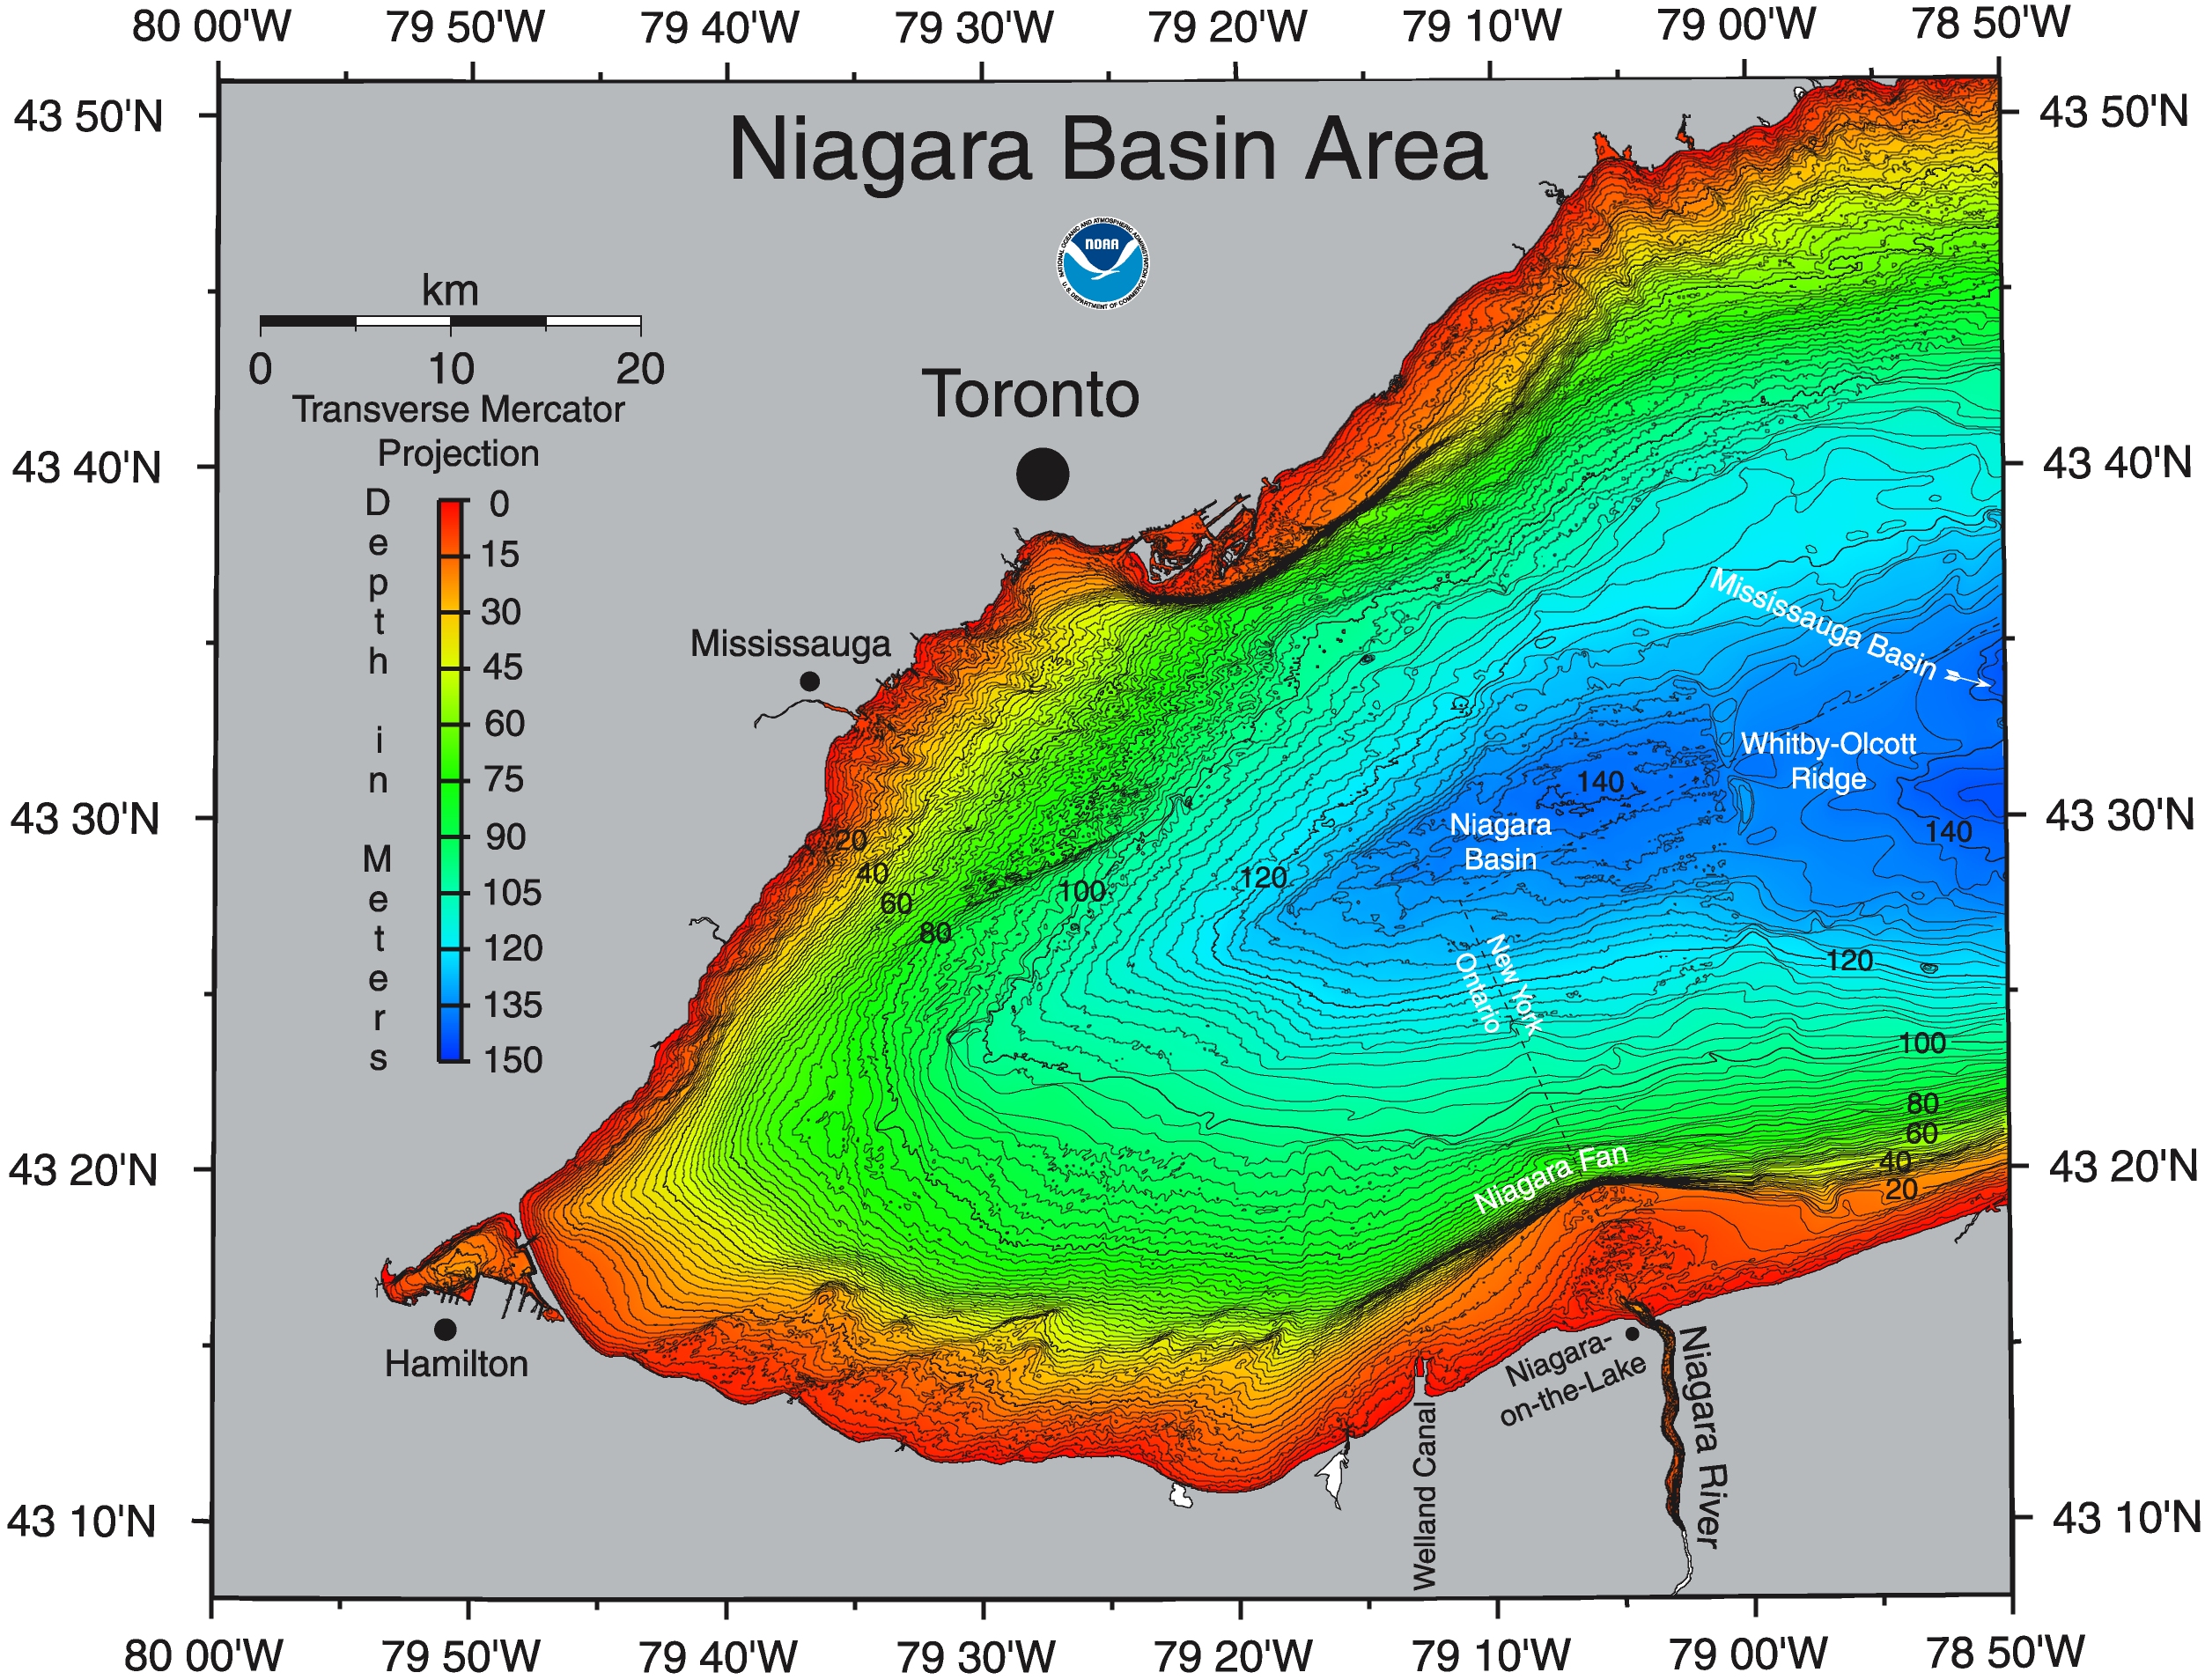
The Lake Ontario bathymetry incorporates multibeam bathymetric data collected by the University of New Brunswick's Ocean Mapping Group (UNB-OMG) with support from the Geological Survey of Canada (GSC) and CHS, along with the historic sounding data that forms the primary basis of the Great Lakes bathymetry project. It confirmed many earlier interpretations of Lake Ontario geomorphology, and shaped new ideas with significant implications for a number of environmental concerns:
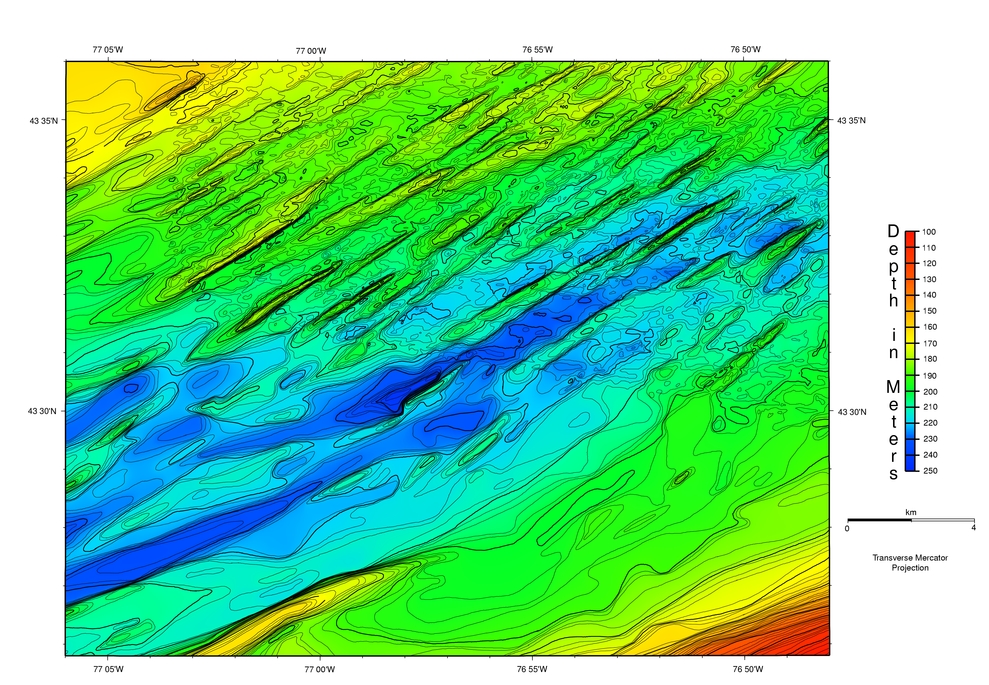
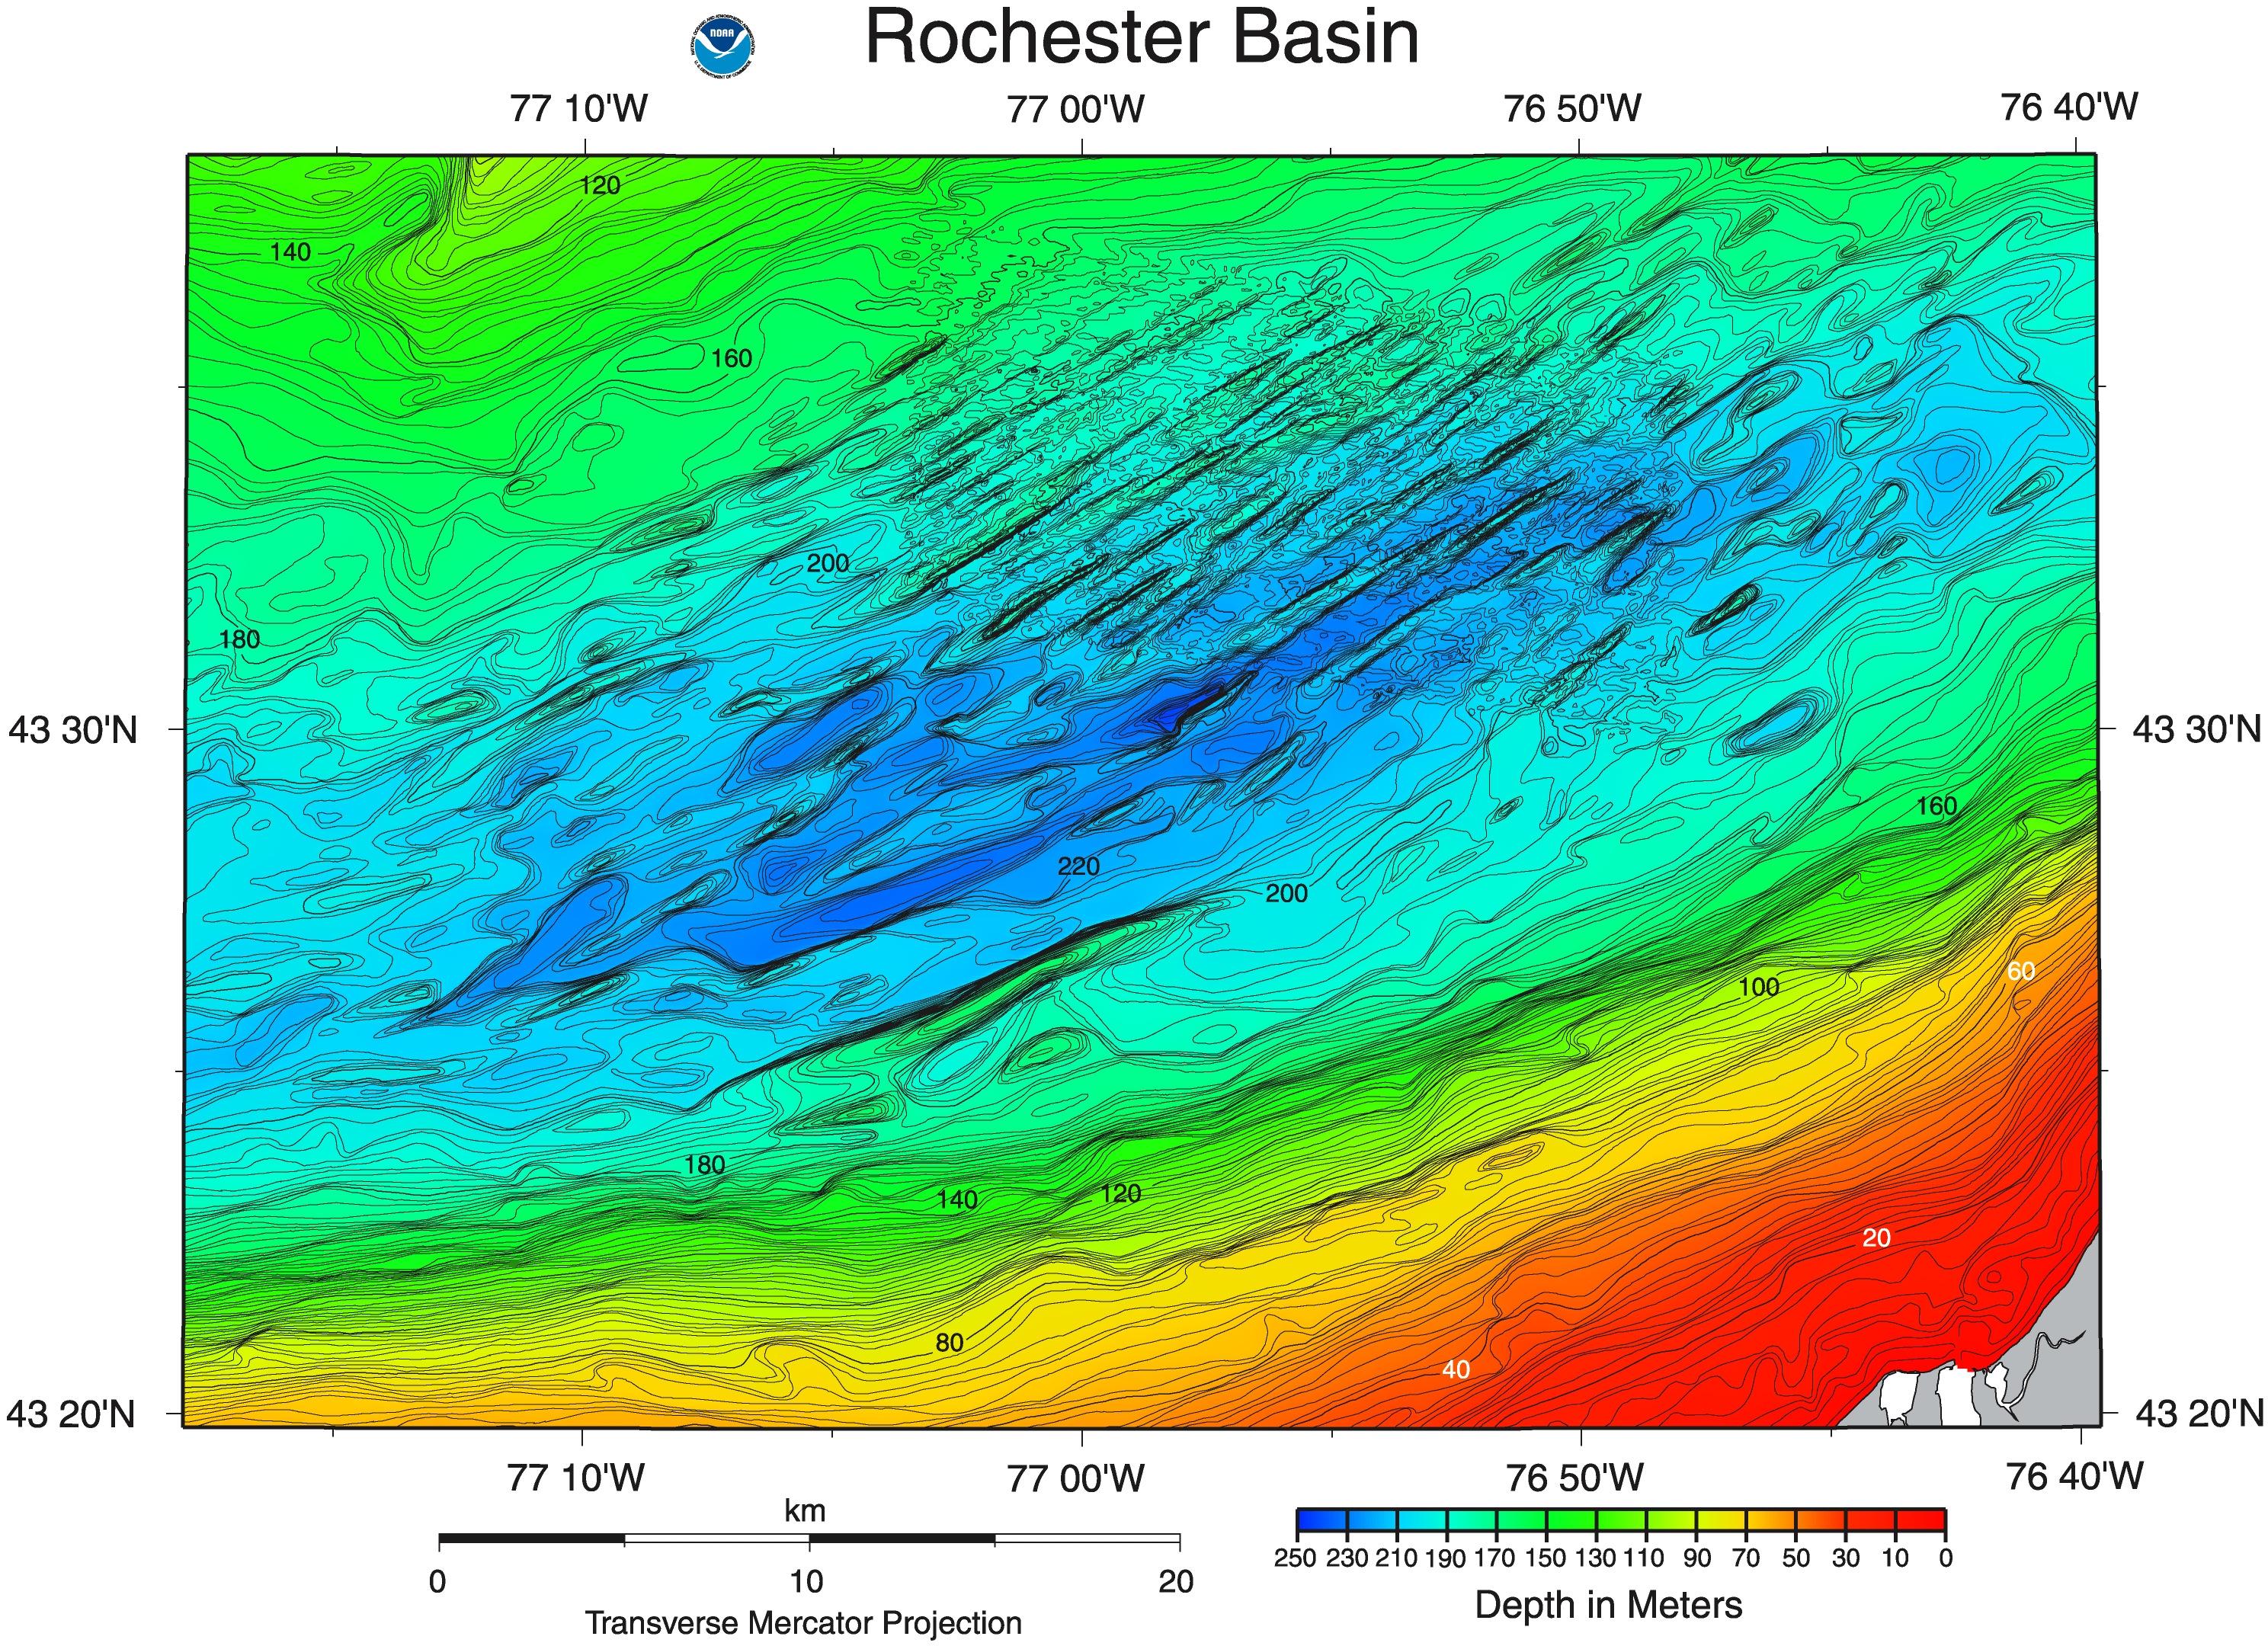
- Linear and parallel ridges (3-D view and flat 3-D view) (1-2km spacing, 15-30m relief), which trace a NE-SW arc on the floor of the Rochester Basin, resemble grooved topography in onshore drumlin fields north of the lake, and therefore may record flow direction of advancing ice and/or subglacial meltwater.
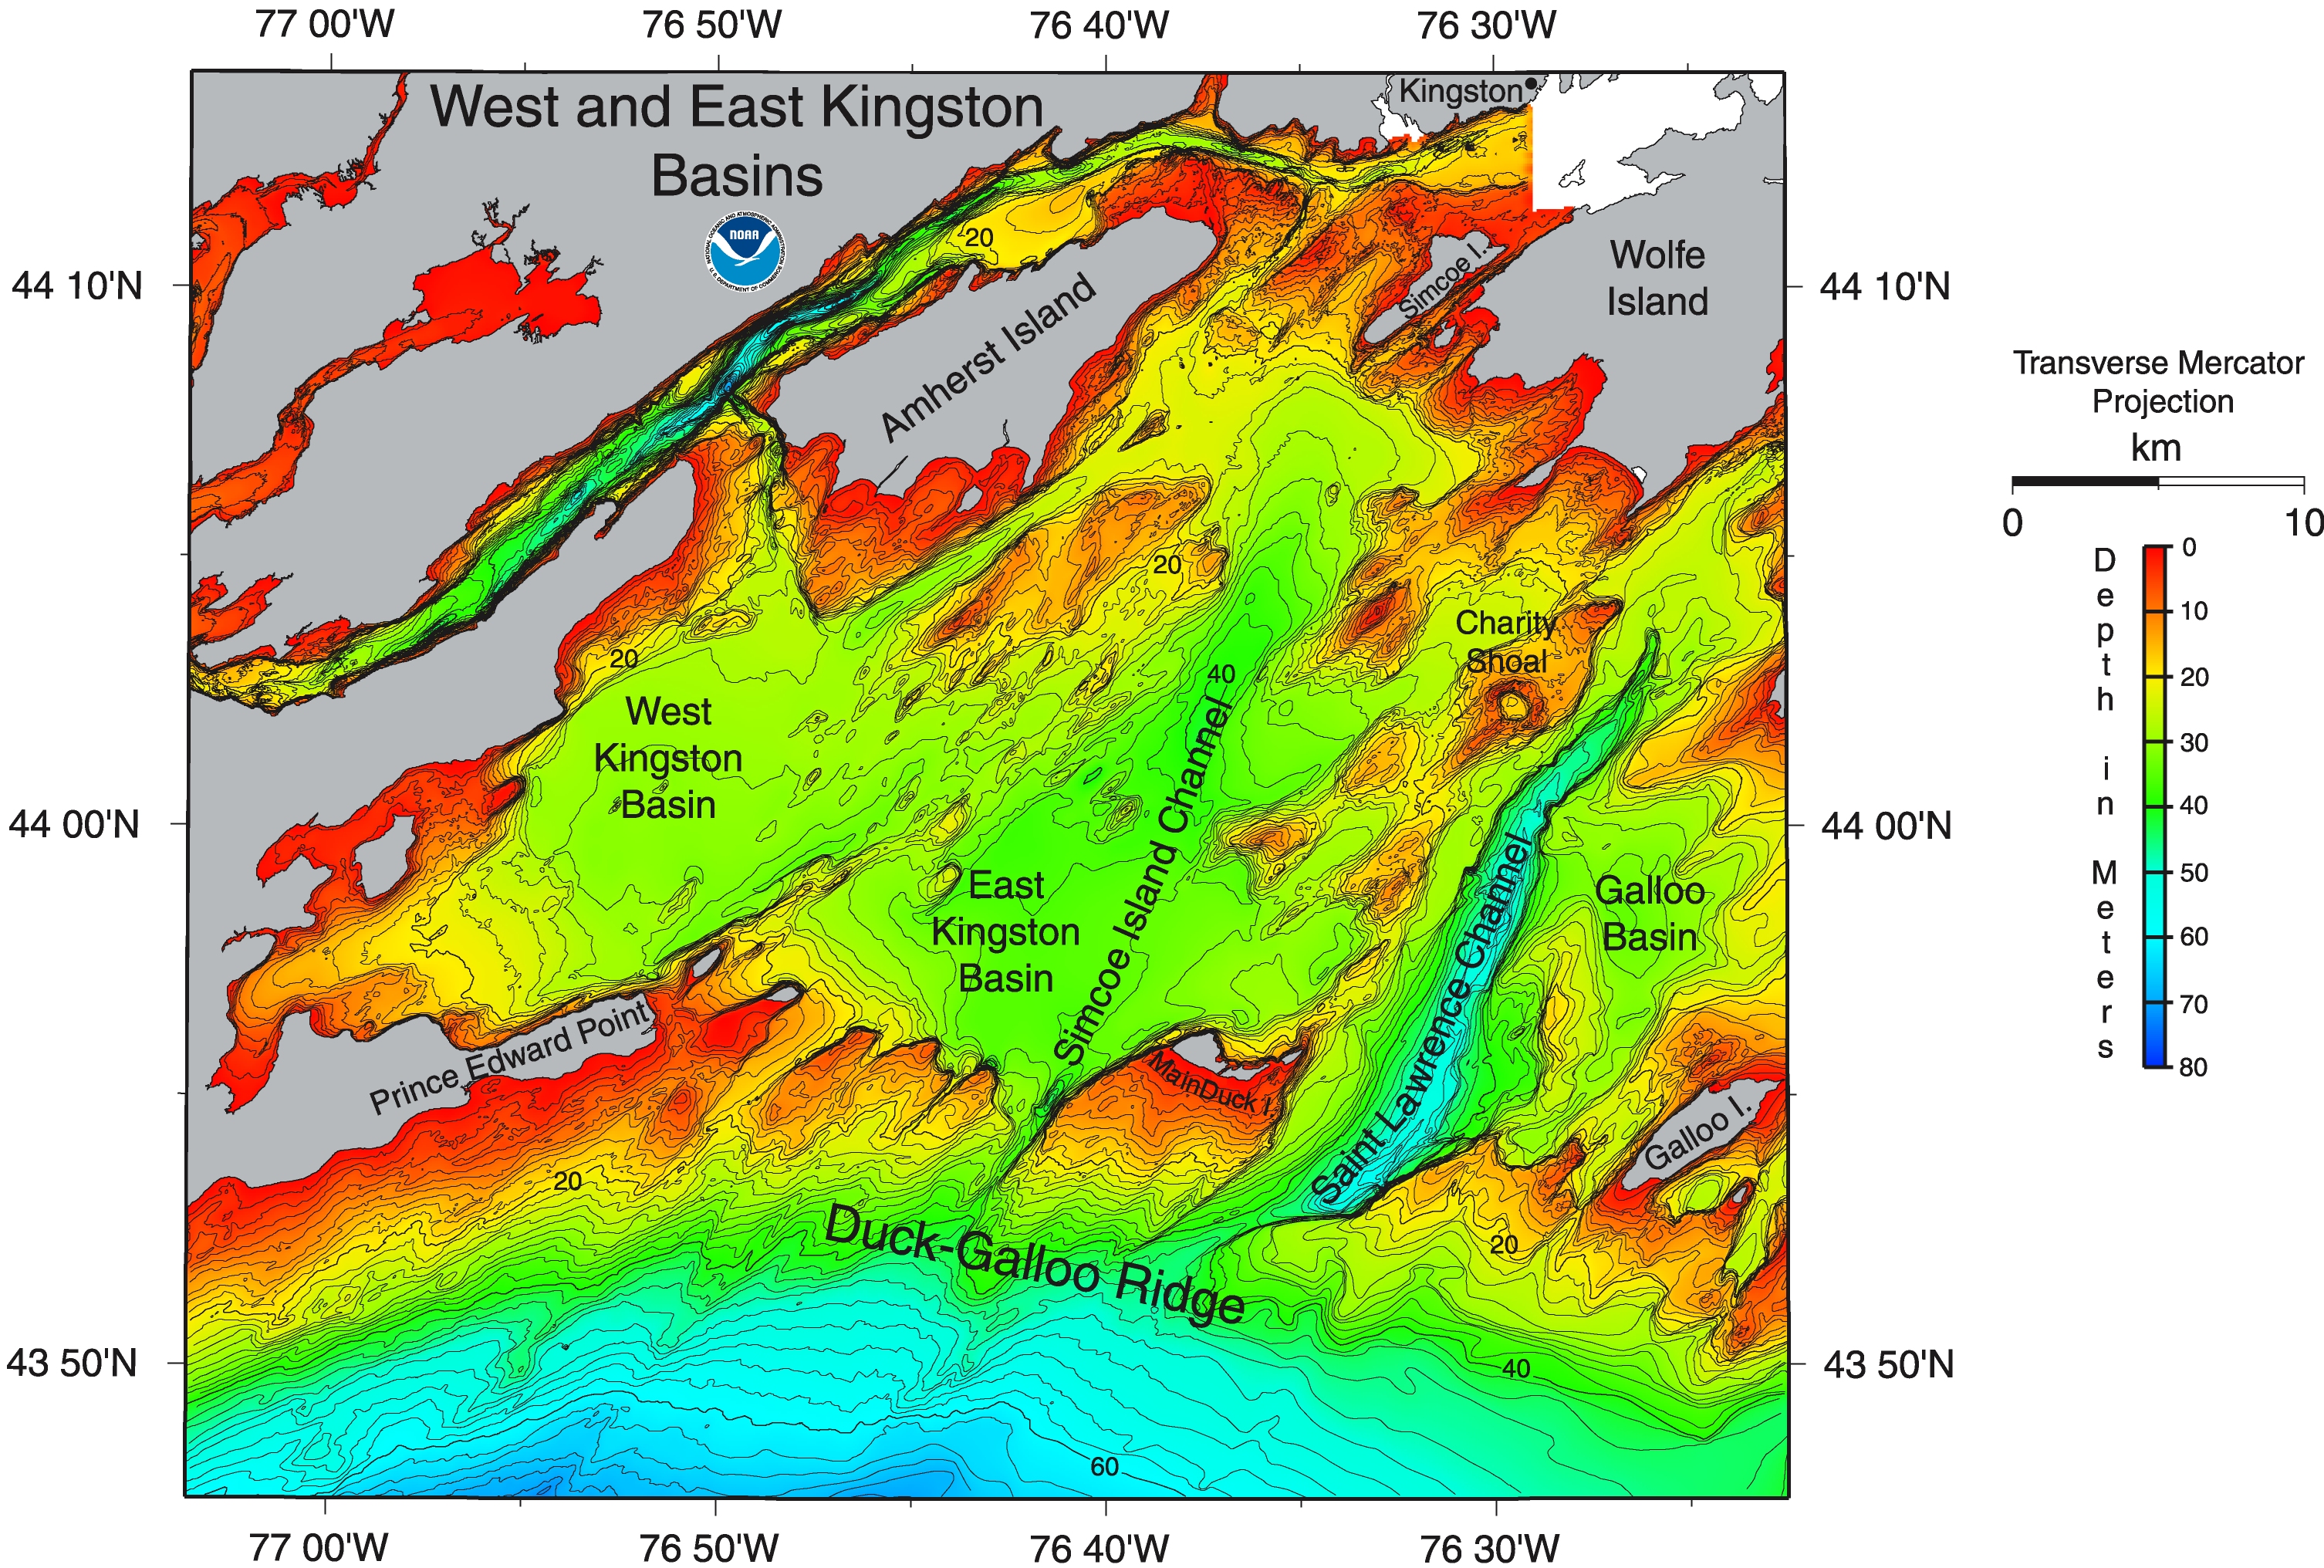
- The Duck-Galloo Ridge is comprised of north-facing cuestas (20-30m relief) formed on resistant Ordovician limestones. Channels incising the Ridge terminate at its southern margin, which probably coincides with location of the Lake Ontario shoreline in early postglacial time.
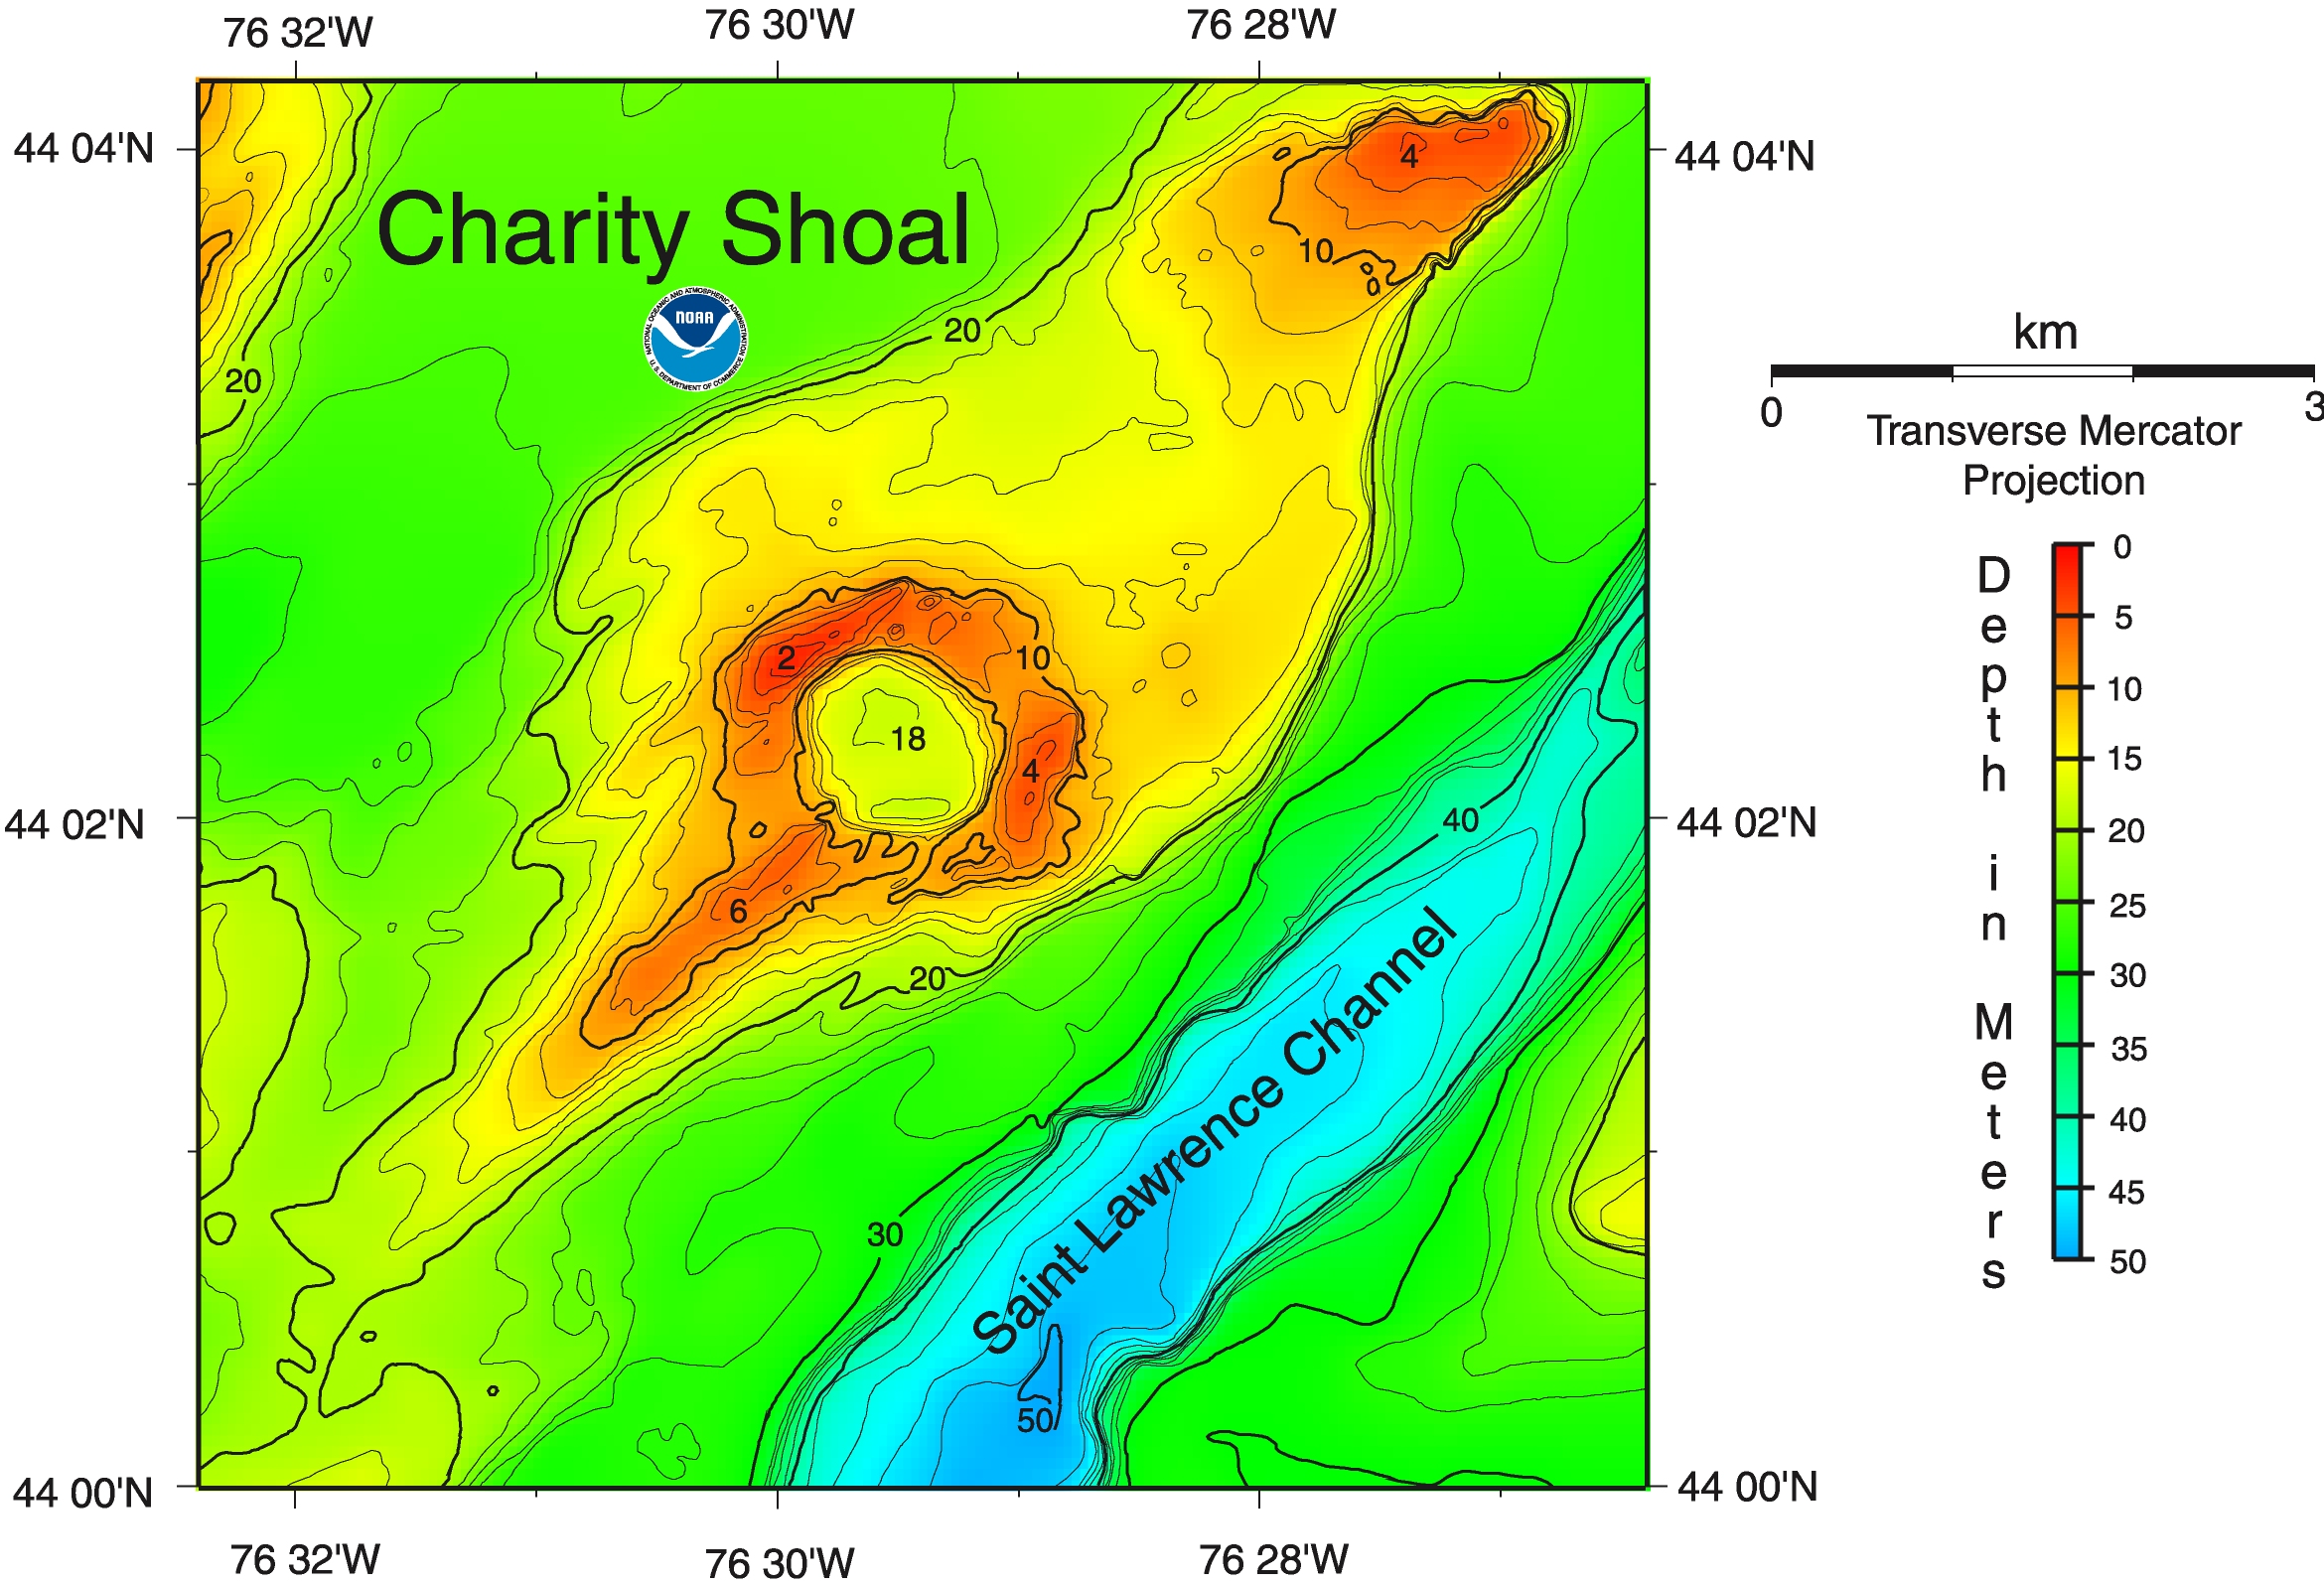
- A small circular depression (3-D view and flat 3-D view) (1000m in diameter, 10-15m relief) with a continuous encircling rim coincides with the feature referred to as Charity Shoal. Origin of the feature remains unknown, although it resembles a simple impact crater.
- Strongly linear bathymetric features displaying the imprint of glaciation, or of exhumation of bedrock topography and structure, occur at intervals along almost all of the near-shore, where strong wave action and currents have evidently prevented deposition of postglacial muds, except in sheltered areas.
The U.S. Board on Geographic Names (BGN) updated geographic names for a number of lakefloor features based on the additional detail revealed by the Lake Ontario bathymetry. The updated names (shown on the Lake Ontario poster) incorporate previously used names (names of precedence) where they exist.
High-resolution digital bathymetry enables meaningful quantitative estimates of available habitats for fish and other living organisms. These estimates have been used in other lakes to formulate regulations to prevent overfishing.
Posters
- Lake Ontario Bathymetry Poster: Large (4320x2592px)
- Close Up (Rochester Area): JPG | EPS | 3-D EPS
- Close Up (Charity Area): JPG | EPS
Images and Geomorphology
Images depicting specific features and bathymetry of the Lake Ontario floor:
Data
About
A draft version of the Lake Superior Bathymetry was compiled as a component of a NOAA project to rescue Great Lakes lake floor geological and geophysical data, and make it more accessible to the public. No time frame has been set for completing bathymetric contours of Lake Superior, though a 3 arc-second (~90 meter cell size) grid is available.
2005 Award
NOAA Scientists Troy L. Holcombe and Lisa A. Taylor (NESDIS/NCEI), and co-authors from NOAA's Great Lakes Environmental Research Laboratories, the NOAA Cooperative Institute for Limnological and Ecosystems Research, the Canadian Hydrographic Service, and Ohio State University, received the International Association of Great Lakes Research (IAGLR) CHANDLER-MISENER award for 2005 for the research paper "Revised Lake Erie Postglacial Lake Level History Based on New Detailed Bathymetry", published in Journal of Great Lakes Research. This award is presented annually by the IAGLR to authors of the “most notable” paper published in the Journal of Great Lakes Research each year. Papers are evaluated on the basis of originality, substantial research contribution, and clarity of presentation.
1998 Award
NOAA Scientists Troy L. Holcombe (NESDIS/NCEI), Lisa A. Taylor (NESDIS/NCEI), and David F. Reid (OAR/GLERL), together with their colleagues, John S. Warren of the Canadian Hydrographic Service, and Charles E. Herdendorf of Ohio State University, also earned the IAGLR Chandler-Misiner award for 1998. The award was presented on May 20 at IAGLR's annual banquet, held in conjunction with the 41st Conference on Great Lakes Research, convened at McMaster University in Hamilton, Ontario.
The winning 1997 paper, "Lakefloor Geomorphology of Western Lake Erie," presented a wide-ranging discussion of Western Lake Erie geology, as revealed by new bathymetry, which the authors compiled. The paper included a large full-color bathymetric map of Western Lake Erie.
Background
The bathymetry and resulting papers were an outgrowth of the NOAA's ESDIM (Earth Science Data and Information Management)-sponsored Great Lakes Data Rescue Project carried out at NOAA's National Environmental Satellite, Data and Information Service (NESDIS) National Geophysical Data Center (NGDC), and the Office of Oceanic and Atmospheric Research's (OAR) Great Lakes Environmental Research Laboratory (GLERL). An international agreement between NOAA and the Canadian Hydrographic Service serves as the basis for U.S. and Canadian cooperative efforts to assemble new bathymetry for the four Great Lakes shared by the two countries.
-
Frequently Asked Questions
- What is the horizontal datum of the Great Lakes Bathymetry?
- The horizontal datum of the Great Lakes bathymetric contours and grids is NAD 83 geographic, which is effectively identical to WGS 84 geographic at the scale of the data. The horizontal differences between the two datums are less than one meter in the Great Lakes region. All source elevation data used in creating the Great Lakes bathymetric contours and grids were transformed to NAD 83 geographic prior to development.
- What is the vertical datum of the data?
- Bathymetric data for each lake is referenced to its own low water datum (LWD). Information on the individual lake datums can be found at NOAA’s Tides and Currents. Grids extracted using NCEI's Grid Extract are referenced to a vertical datum of Mean Sea Level.
- What are the vertical units of the data?
- Elevations of Great Lakes bathymetric data are in meters.
- Are there data usage restrictions?
- Products derived primarily from NCEI data are not subject to copyright protection in the United States. Please acknowledge NCEI as the source using the citations and DOIs listed in the Data Access section.
- When will Lake Superior be completed?
- No time frame has been set for completing bathymetric contours of Lake Superior, though a 3 arc-second (~90 meter cell size) grid is available.
- Does this project include fishing maps for the Great Lakes?
- No. NCEI has fishing maps of U.S. coastal and offshore waters are available, and there are NOAA Nautical Charts for the Great Lakes.
 encompasses the U.S. Eastern Seaboard, Gulf of Mexico, Puerto Rico/U.S. Virgin Islands, and Hawaii.")

