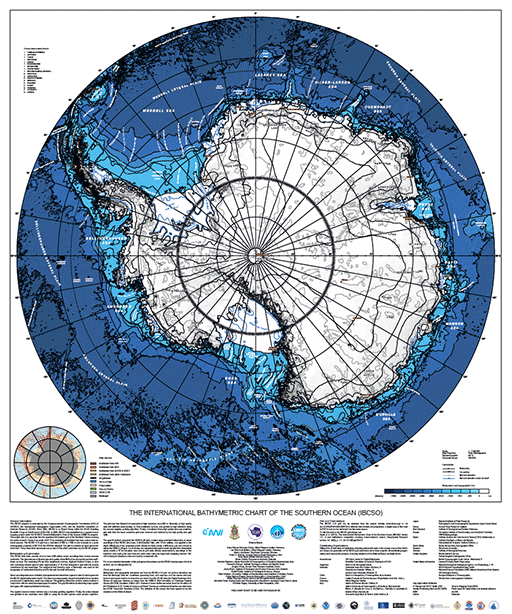
INTERNATIONAL BATHYMETRIC CHART OF THE SOUTHERN OCEAN (IBCSO)
IBCSO Version 1.0 Chart of Southern Ocean Bathymetry
Please use the online store for all orders within the USA.
The IBCSO Poster, 2013, is a polar stereographic view of the Southern Ocean displaying bathymetric contours south of 60° S at a scale of 1:7,000,000. The poster size is 39.25 x 47.125 inches. To cite this chart or the IBCSO grid please use:Arndt, J.E., H. W. Schenke, M. Jakobsson, F. Nitsche, G. Buys, B. Goleby, M. Rebesco, F. Bohoyo, J.K. Hong, J. Black, R. Greku, G. Udintsev, F. Barrios, W. Reynoso-Peralta, T. Morishita, R. Wigley, "The International Bathymetric Chart of the Southern Ocean (IBCSO) Version 1.0 - A new bathymetric compilation covering circum-Antarctic waters", Geophysical Research Letters, doi: 10.1002/grl.50413 General Information:The International Bathymetric Chart of the Southern Ocean (IBCSO) program is endorsed by the Intergovernmental Oceanographic Commission (IOC) of UNESCO, the International Hydrographic Organization (IHO), and the Scientific Committee on Antarctic Research (SCAR). Since 2004, IBCSO has been an Expert Group within the SCAR Standing Scientific Group on GeoSciences (SSG-GS). In 2006, IBCSO was established as a regional ocean mapping project under the IHO/IOC General Bathymetric Chart of the Oceans (GEBCO) program. The project aim is to generate the first seamless bathymetric grid of the Southern Ocean covering the entire Antarctic Treaty Area south of 60 degrees S by compiling all available data from various international sources. The IBCSO v1.0 grid has a resolution of 500 m x 500 m and is based on a polar stereographic projection at 65 degrees S on the WGS-84 ellipsoid. The grid is available as open source for download. This printed chart represents one product resulting from the IBCSO project. Bathymetric grid generation:The IBCSO data base consists of more than 4200 million ocean soundings from various sources worldwide. The data sets are of diverse type and quality. About 98% of the data points are from multibeam surveys. The remaining 2% are from singlebeam surveys, digitized Nautical Charts, or data sets containing various types of data. Approximately 17 % of the bathymetric grid cells are directly constrained by real soundings. The subglacial bed elevation layer of Bedmap2 was used for the topography of continental Antarctica and for the sub ice-shelf bathymetry. Sonar sounding data were validated, homogenized and stored into a generic data format to generate the IBCSO digital bathymetric model. The data was subsequently cleaned and gridded in an iterative process until a satisfactory result was achieved. The gridding utilized the remove-restore method in conjunction with the newly developed gap-fill method. The gap-fill method is restocking major spatial data gaps with aligned predicted bathymetry. The applied remove-restore method was a two-step gridding algorithm. Firstly, the entire dataset was gridded at low resolution, here 2000 m, using the bi-cubic splines under tension algorithm. The grid was then filtered and resampled at high resolution, here 500 m. Secondly, all high quality data with sufficient areal density, i.e. from multibeam surveys, was gridded at high resolution using the nearest neighbor gridding algorithm. Finally, in locations where high quality data was available, grid cells from the lower resolution grid were removed and restored by the high quality data grid cells. The gap-fill method compared the GEBCO_08 grid, created using predicted bathymetry, to sonar soundings of the IBCSO data base. A blockmedian filter, with 10 km cellsize, was applied to the depth differences of the compared points. Based on these points, a difference grid was created to adjust the GEBCO_08 grid. In a final step, the adjusted bathymetric model replaced the interpolated areas outside a 10 km transition zone next to grid cells, directly constrained by soundings. In the transition zone both grids were bent into each other using the hyperbolic weighting function 1/d, with d being the distance to the next directly constrained cell. For a more detailed description of the grid generation please see the IBCSO release paper (Arndt et al 2013; doi:10.1002/grl.50413). Chart generation:Bathymetric and topographic elevations are from the IBCSO v1.0 grid. Ice surface elevations are from the Bedmap2 data set. Coastlines, grounding lines, rock outcrops, and the names and positions of permanent stations in Antarctica are taken from the SCAR Antarctic Digital Database v6.0. Names of undersea features are taken from the GEBCO Sub-Committee on Undersea Feature Names (SCUFN) Gazetteer, Edition 2011. Names of ocean bodies are taken from the 4th edition of IHO Publication S-23, "Limits of Oceans and Seas". Names on continental Antarctica are taken from the SCAR Composite Gazetteer (CGA). The selection of the names has been agreed on by the members of the Editorial Board. Grid and Chart retrieval:The IBCSO v1.0 grid can be obtained from the project website (www.ibcso.org) or via doi:10.1594/PANGAEA.805736 in different data formats and projections. A digital copy of this chart in PDF format can be retrieved from the same source.
For additional information and data from IBCSO, please visit the IBCSO web pages:
|
| All Bathy/Relief | Coastal DEMs | Fishing | Global | Lakes | Multibeam | NOS |
