State Topography Images: How Were They Made?
This image was developed in the following way:
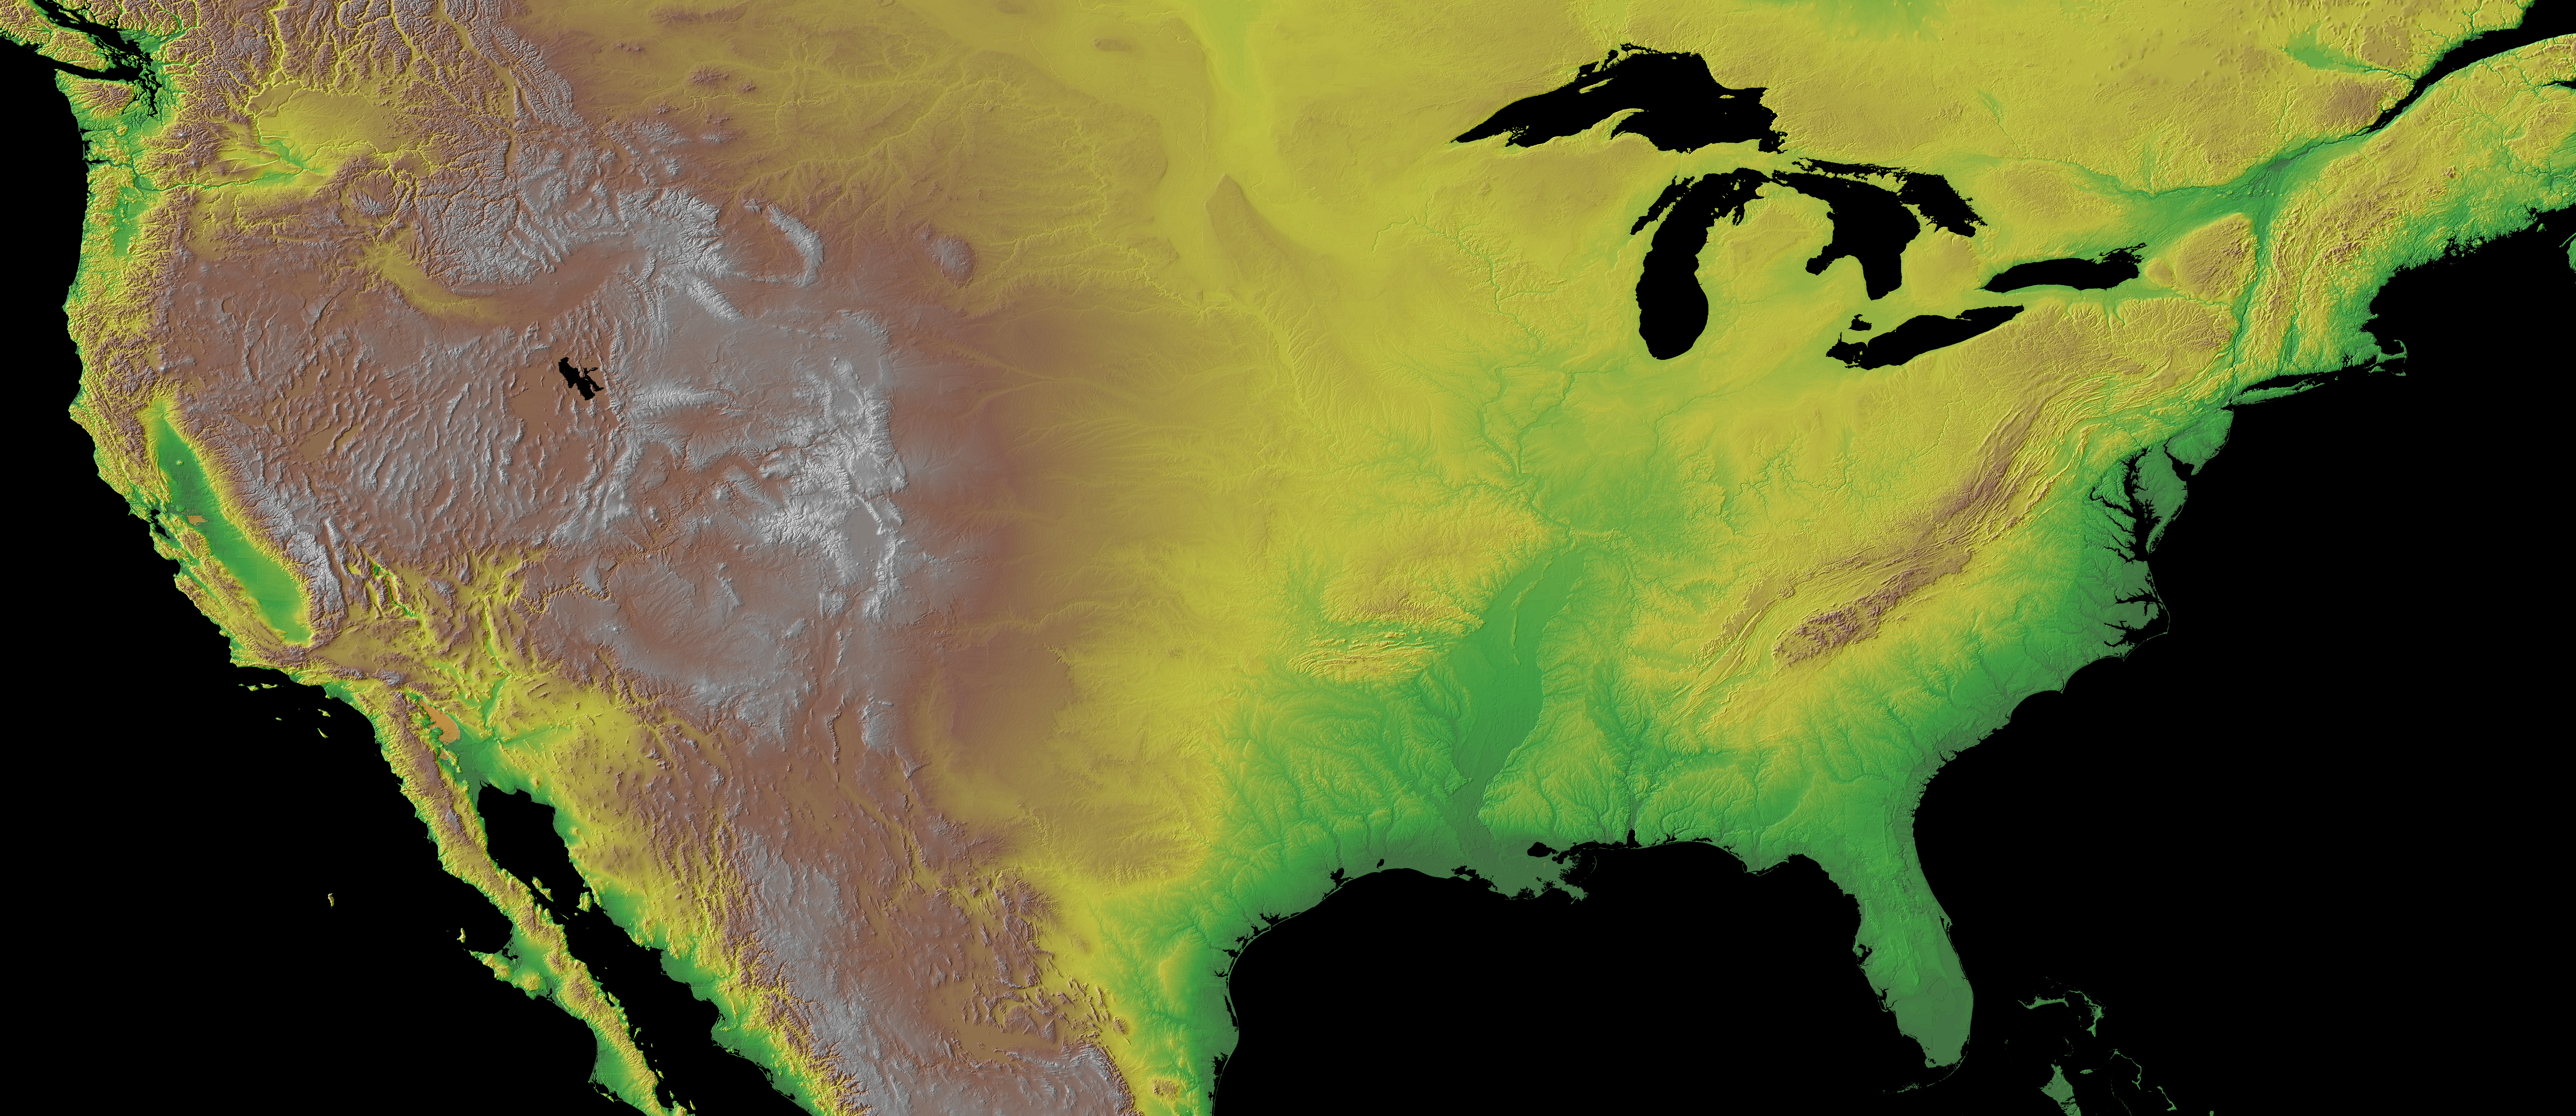
- Select the appropriate area for the Conterminous USA from the Global Land One-Kilometer Base Elevation (GLOBE) 30 arc-second digital elevation model (DEM).
- Take the square root of the elevations. This brings out details in low-lying areas that are commonly lost to the ruggedness of mountainous areas. Adjust the values to fit the "byte" (0-255) data range.
- Create a color image, and make 3-color separates. Note: This was done in the GRASS Geographic Information System, as we preferred its performance for the sqare root transformation, as well as the color editing.
- Develop a color palette for displaying topographic data. This particular palette has 256 colors.
- Display the selected area, with the chosen palette, in a raster geographic information system (GIS).
Optimize the color table.
- Create Red, Green, and Blue ("RGB") color separates of the color image created by applying the color palette to the elevation data set.
- Create a shaded-relief image of the data. Note: This was done in the Idrisi GIS, as we preferred its performance in making and enhancing the shaded relief image.
- Run the shaded-relief function over the square-root-transformed data.
- Enhance the contrast of the results to taste.
- Mask out oceans and selected lakes.
- Blend the shaded-relief and color images. Though this is commonly done with Hue-Intensity-Saturation transformations, we simply add and rescale the grey-scale shaded-relief image with the RGB color separates from the color image. (This is most conveniently done in the blend.sh shell script included with GRASS.) Convert this image to a
- 24-bit tiff for desktop publishers,
- a 24-bit .jpg image for viewing on the Web, and
- an 8-bit bitmap (.bmp) for porting into a GIS.
We made the 24-bit tiff in Adobe Photoshop (though we now do this to a 24-bit .bmp in Idrisi32, the latest version of that program).
- Import the bitmap into a GIS (in this case, Idrisi). We do the conversions between picture formats in Photoshop or Ulead PhotoImpact.
- Cut each state from the image of the Conterminous USA. For some smaller states (e.g., Rhode Island and Providence Plantations, Delaware, and Connecticut), we doubled the size of the "map" by replicating the data. For some larger states (e.g. California, Texas, Montana) we halved the size of the map (to cut back on scrolling in a browser) by decimating every other column and row in the 30" image.
- Re-display the image, adding state and county boundaries.
- Save the image to a bitmap.
- Convert the resultant image to a .jpg image for Web browsing.
This is the third version of this site. The first version contained 8-bit .gif images of a 16-color display. It previously lacked the color editing of selected water bodies. This site also shows much more information about the surface relief of each state. Yet the old version of this site earned mention in a discussion of NGDC's Website as a "top ten" Earth Online site in the April 1996 issue of Earth magazine. We hope that you enjoy these images!
In our review of Web browsers, we detect a tendancy for browsers to plot the .jpg images at lower resolution than the image editors available to us. If you use a dedicated picture editor/viewer, you may find the displays crisper than when viewed here on the Web. You are free to save these images, and use them for any purpose. They are NOT copyright. If you care to reference us as the source, and/or link to this site, we would appreciate it.
The images are unprojected, in geographic (latitude-longitude) projection. For such small areas, we believe that almost any projection will serve the intended purpose of showing the exciting relief patterns of your state. If you would like to go farther, may we suggest?:
- Reprojecting the state into the projection of your choice, using any projection software that might be available to you, or
- Obtaining and reworking the actual source data from the Global Land One-km Base Elevation (GLOBE) DEM Project.
|
