5.A.v. DEM for New Zealand
|
Primary Developer:
|

|
Manaaki Whenua Landcare Research, Ltd. (LCR)
|
|
Title:
|

|
DEM for New Zealand
|
|
Publication Date:
|

|
1996
|
|
Bibliographic Citation:
|
*
|
Manaaki Whenua Landcare Research, 1996. 500m Digital Elevation Model for New Zealand. Manaaki Whenua Landcare Research, Ltd., Lincoln, New Zealand (in USGS, 1997; also in GLOBE Task Team and others, 1999.)
|
|
Post-processing:
|

|
U.S. Geological Survey (for GTOPO30).
|
|
Source/Lineage Category:
|

|
11
|
* Primary reference citation for all data from this source
Manaaki Whenua Landcare Research, Ltd. (LCR), contributed a DEM with a 500m horizontal grid spacing for New Zealand to USGS for GTOPO30. This map was in New Zealand’s national projection. The DEM was adapted from elevation information on
1:63,360-scale maps (e.g. 1 inch = 1 mile scale). The source maps have a 30m (100ft) contour interval.
The original projection is described as follows:
 Method of projection: Modified Cylindrical. A sixth-order conformal Method of projection: Modified Cylindrical. A sixth-order conformal
  modification of a Mercator using the International spheroid. modification of a Mercator using the International spheroid.
 Points of tangency: 41o00' South, 173o00' East. Points of tangency: 41o00' South, 173o00' East.
 Linear graticules: None. Linear graticules: None.
 Properties: Properties:
  Shape: Conformal. Local shapes are correct. Shape: Conformal. Local shapes are correct.
  Area: Minimal distortion, less than 0.04 percent for New Zealand. Area: Minimal distortion, less than 0.04 percent for New Zealand.
  Direction: Minimal distortion within New Zealand. Direction: Minimal distortion within New Zealand.
  Distance: Scale is within 0.02 percent of true scale for New Zealand. Distance: Scale is within 0.02 percent of true scale for New Zealand.
 Limitations: Projection not useful for areas outside New Zealand. Limitations: Projection not useful for areas outside New Zealand.
USGS reprojected the data to 30" latitude-longitude projection using bilinear resampling.

|
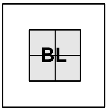
Cell-centered registration, bilinear resampling of source 500m grid
Graphic describing georeferencing and sampling for the DEM for New Zealand.
|

Plate 18.

Plate 19.
Click on each image
to view larger size.
|

|
Plates 18 and 19 show spikes at approximately 30m (100ft) intervals below 606m (2000ft). There are additional spikes at about 750m (2500ft) and 900m (3000ft). Above that
elevation, the histograms are relatively smooth. This suggests that the vertical granularity of the source maps may be more appropriate at higher elevations than for lower elevations. Nevertheless, the DEM is of relatively high quality for one
apparently derived from cartographic sources. There is a modest trough in values between 100m and 150m.
|


Return to Report Introduction
|


